Working with Census Data
Problem: The Office of State Human Resources has requested a map showing the number of females aged 45-54 without health insurance in each county in Pennsylvania.
Analysis Procedures:
Strategies and Methods: I will use data collected through the U.S. Census Bureau American Fact Finder to create this map. By searching this site, I found Health Insurance Coverage Status by Sex by Age (ID B27001), 2015 ACS 5-year estimates for all counties in Pennsylvania. The metadata explained which field represents females aged 45-54 years with no health insurance coverage. I also found the TIGER shapefile for counties for 2010 in Pennsylvania on the US Census bureau site. I edited the format of the data fields so that they matched, removed redundant field headings, and unrecognizable characters from the heading fields using Excel. In ArcMap (version 10.5.1), I projected the TIGER shapefile to a locally appropriate format (State Plane) and set the data frame to this projection. I added a numerical field to the shapefile, and populated it with the unique county identification code, so the data types matched in both files. I performed a one-to-one join based on the unique county identification field. I was then able to prepare the required map (Fig. 1).
Workflow Diagram:
 Fig. 1. Workflow diagram for using census data.
Results: By ensuring the data formats were the same, I was able to perform a join so that the shapefile included the tabular information. By symbolizing the layer based on the proper field I could create a map layout that depicted the desired information (Fig. 2).
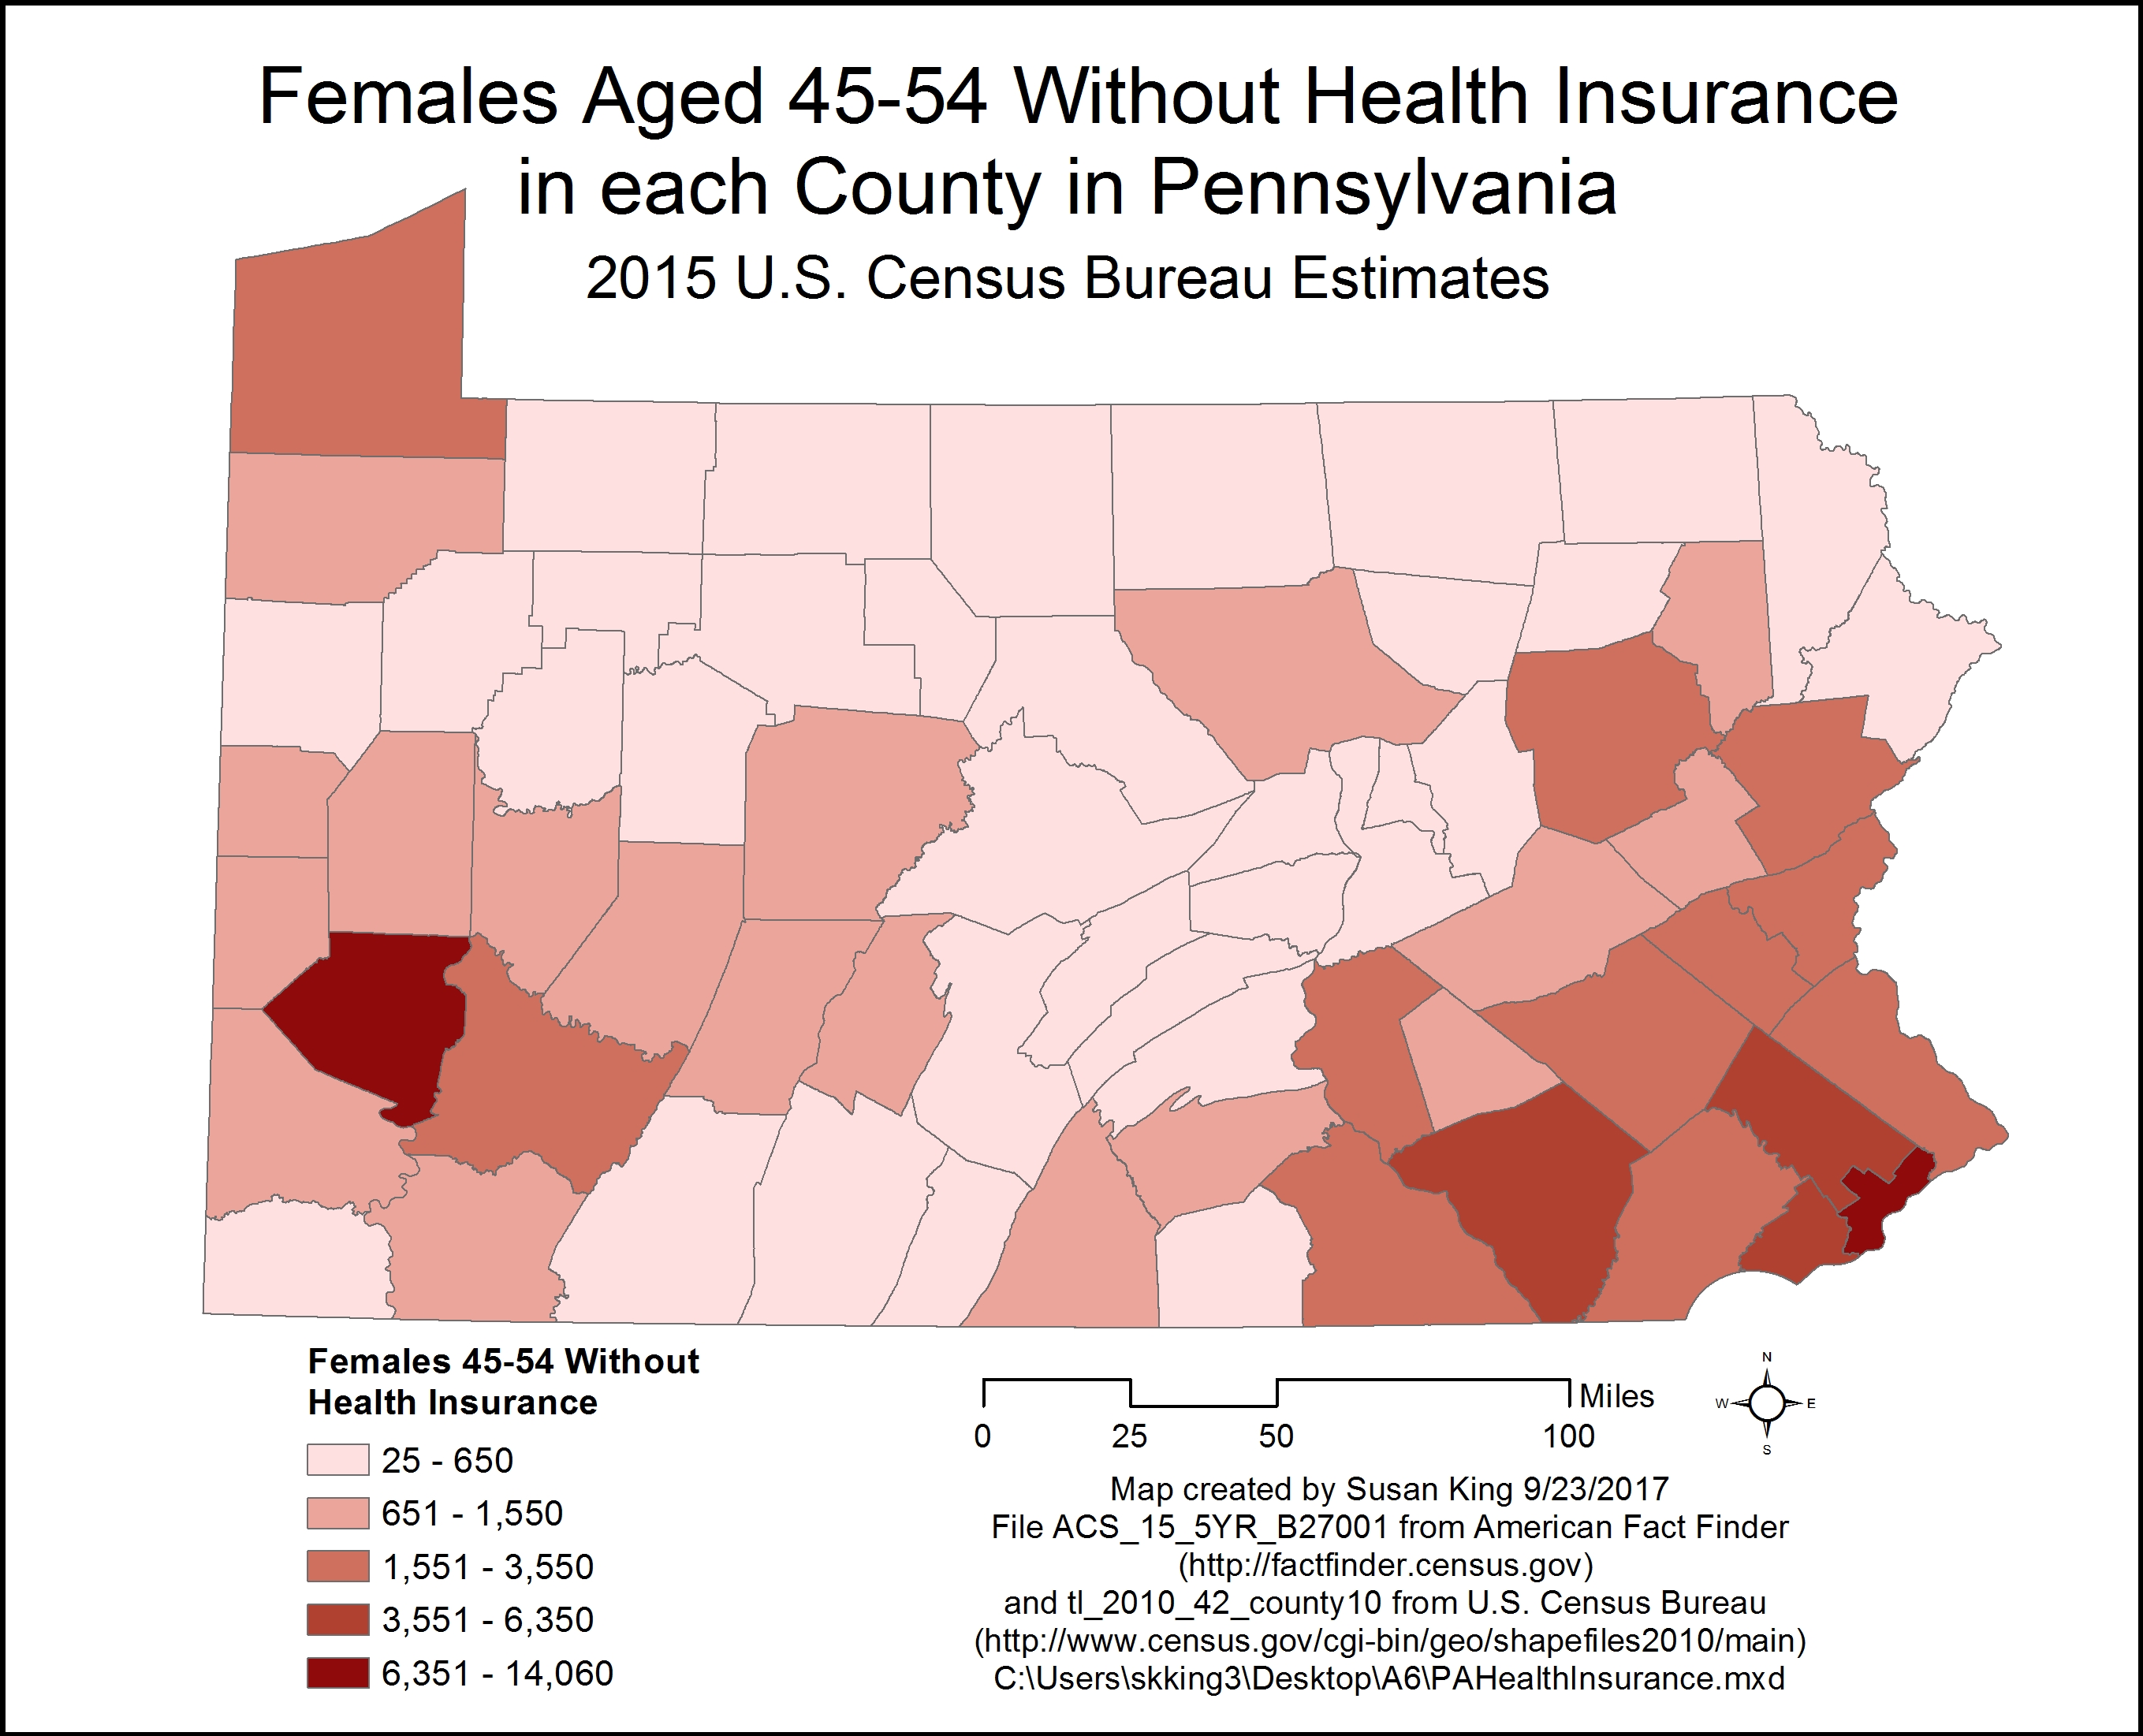 Fig. 2. Performing a tabular join of Census data with Census shapefiles allows the tabular data to be displayed in map format. Click on image for larger version.
Application and Reflection: There is a plethora of census information that is available and could be used to answer many questions about socio-economic factors, so understanding how to search these records for the data you want and find the appropriate shapefile to join with this data is an important skill.
Problem Description: A community farm is interested in setting up a local food co-op that sources food from nearby farms, and caters to the Hispanic population. You are interested in determining locations with higher populations of Hispanic or Latino people to base your decision on where to locate the food co-op.
Data needed: The data you need is available through the U.S. Census Bureau using the websites listed above. You search Geographies using Census Tracts in North Carolina, fully/partially rural and then search Race & Ethnicity for Hispanic or Latino, and then download the QT-P10 file. You then obtain the 2010 Census tracts for all counties in North Carolina TIGER shapefile.
Analysis Procedures: Examine and prepare the data so the field types match, and all redundant headings and unrecognized characters are removed. Using ArcMap you join the census table with the TIGER shapefile. Then you can symbolize the data based on the appropriate variable and create a map layout that helps you determine which location would be best for the new food co-op.
Back to Data Cardinality Forward to Spatial Pattern Analysis
