Tabular and Spatial Joins
Problem: The state congress of North Carolina would like to see how many jobs have been created in their districts, and how their district compares to other districts. This will involve performing tabular and spatial joins, as well as summarizing (aggregating) data.
Analysis Procedures:
Strategies and Methods: A spreadsheet containing the results of a jobs survey, which indicates the number of jobs created and the location of the place of employment, has been provided. I obtained ZIP Code point (location) data from Esri and shapefiles for the boundaries of each state house and senate district from NC OneMap. I examined the data in the spreadsheet and shapefiles to determine which field was available for joining, the cardinality and format of the data, and projection used. The ZIP Code points included data for the entire country, so I used the Select by Attributes tool in ArcMap (version 10.5.1) to select only those ZIP Codes for North Carolina, and exported the data as a shapefile. Because there may be many records for jobs in each ZIP Code, I used the Summarize tool to aggregate (sum) the new jobs based on the ZIP Code field, and this result was joined to the ZIP Code points in North Carolina using the ZIP Code field. Because the representatives were only interested in jobs that were created, I used the Select by Attributes tool to select ZIP Codes with a sum of jobs greater than zero, and then exported this data as a shapefile. I used Spatial Join to join this shapefile to the boundaries of both the State House and Senate districts. Because each district may include more than one ZIP Code where jobs had been created, I used the Summarize tool to aggregate (sum) the jobs created based on the district, and joined this aggregated table to the district boundary shapefile. Because districts with no jobs are still represented, I used Select by Attributes to select only those districts where jobs were created and exported this data as a shapefile. This was used with the boundaries to create maps that show the number of new jobs in the Senate and Representative’s districts (Fig. 1).
Workflow Diagram:

Fig. 1. Workflow diagram for performing tabular and spatial joins in ArcGIS.
Results: The methods described returned a shapefile that contained information on the number of jobs that had been created based on location, first for zip code, and then for state congressional district. This allowed me to create maps that depicted this information in a clear format (Fig. 2).
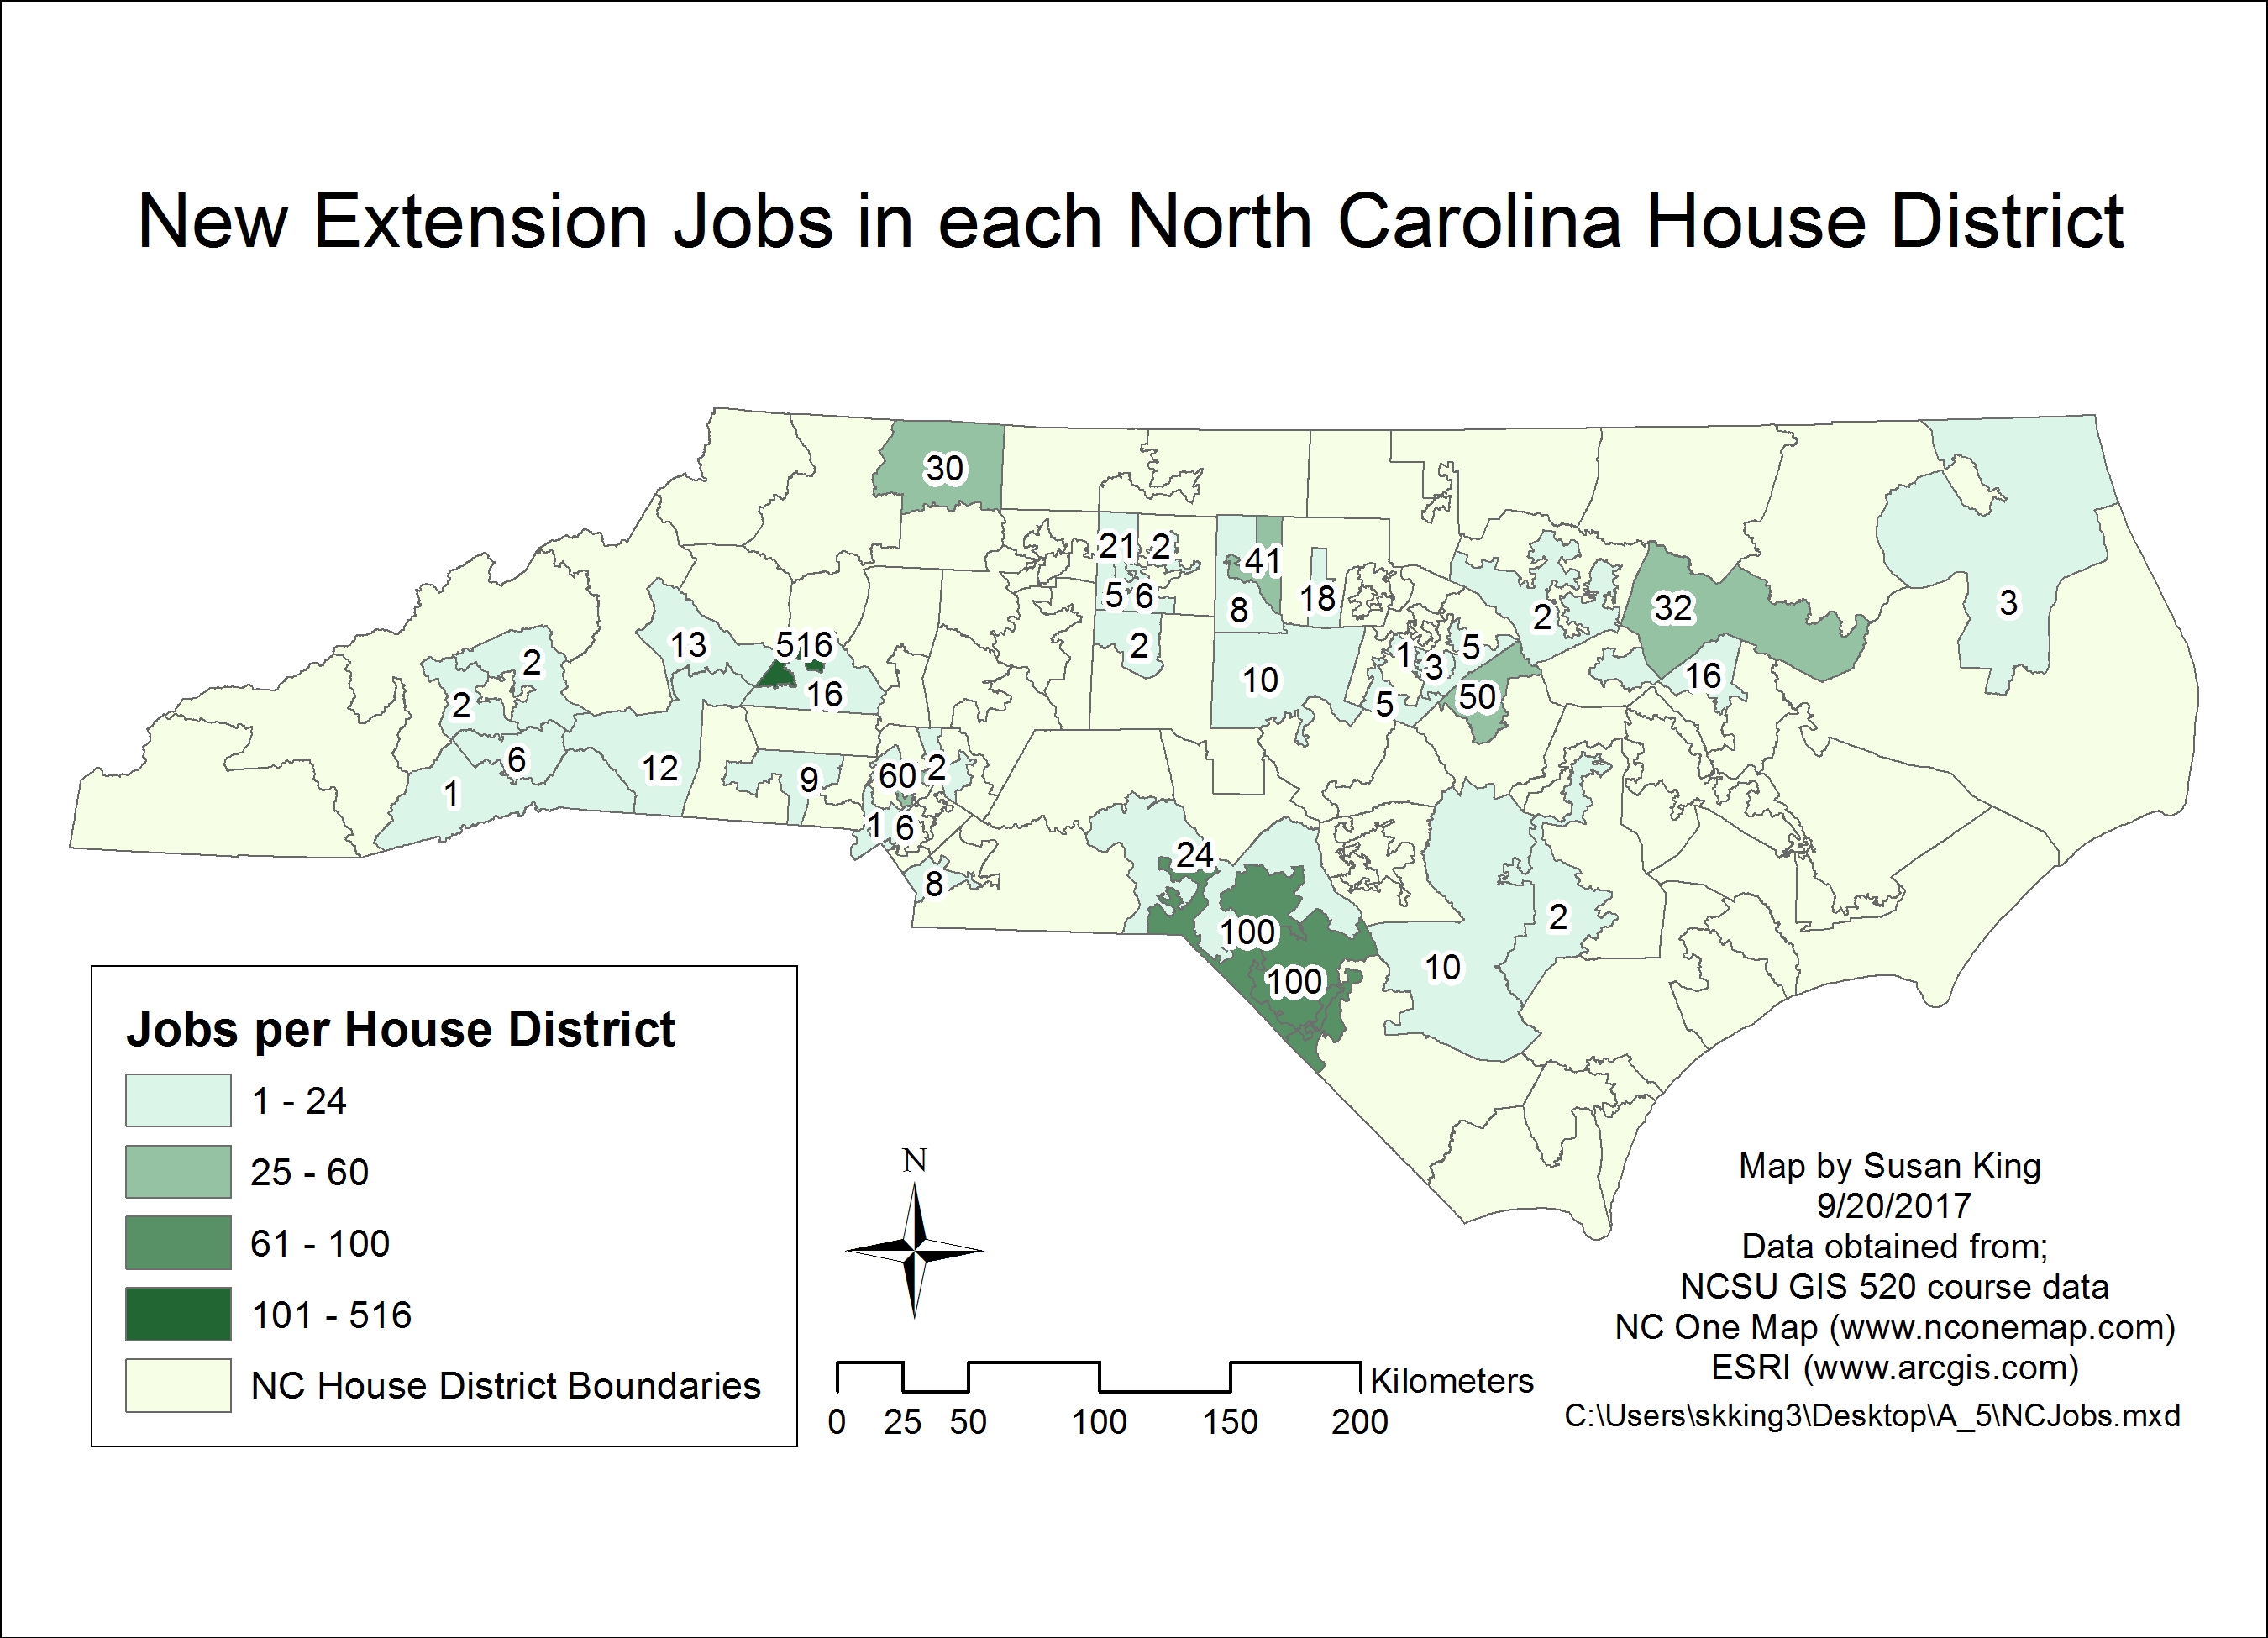
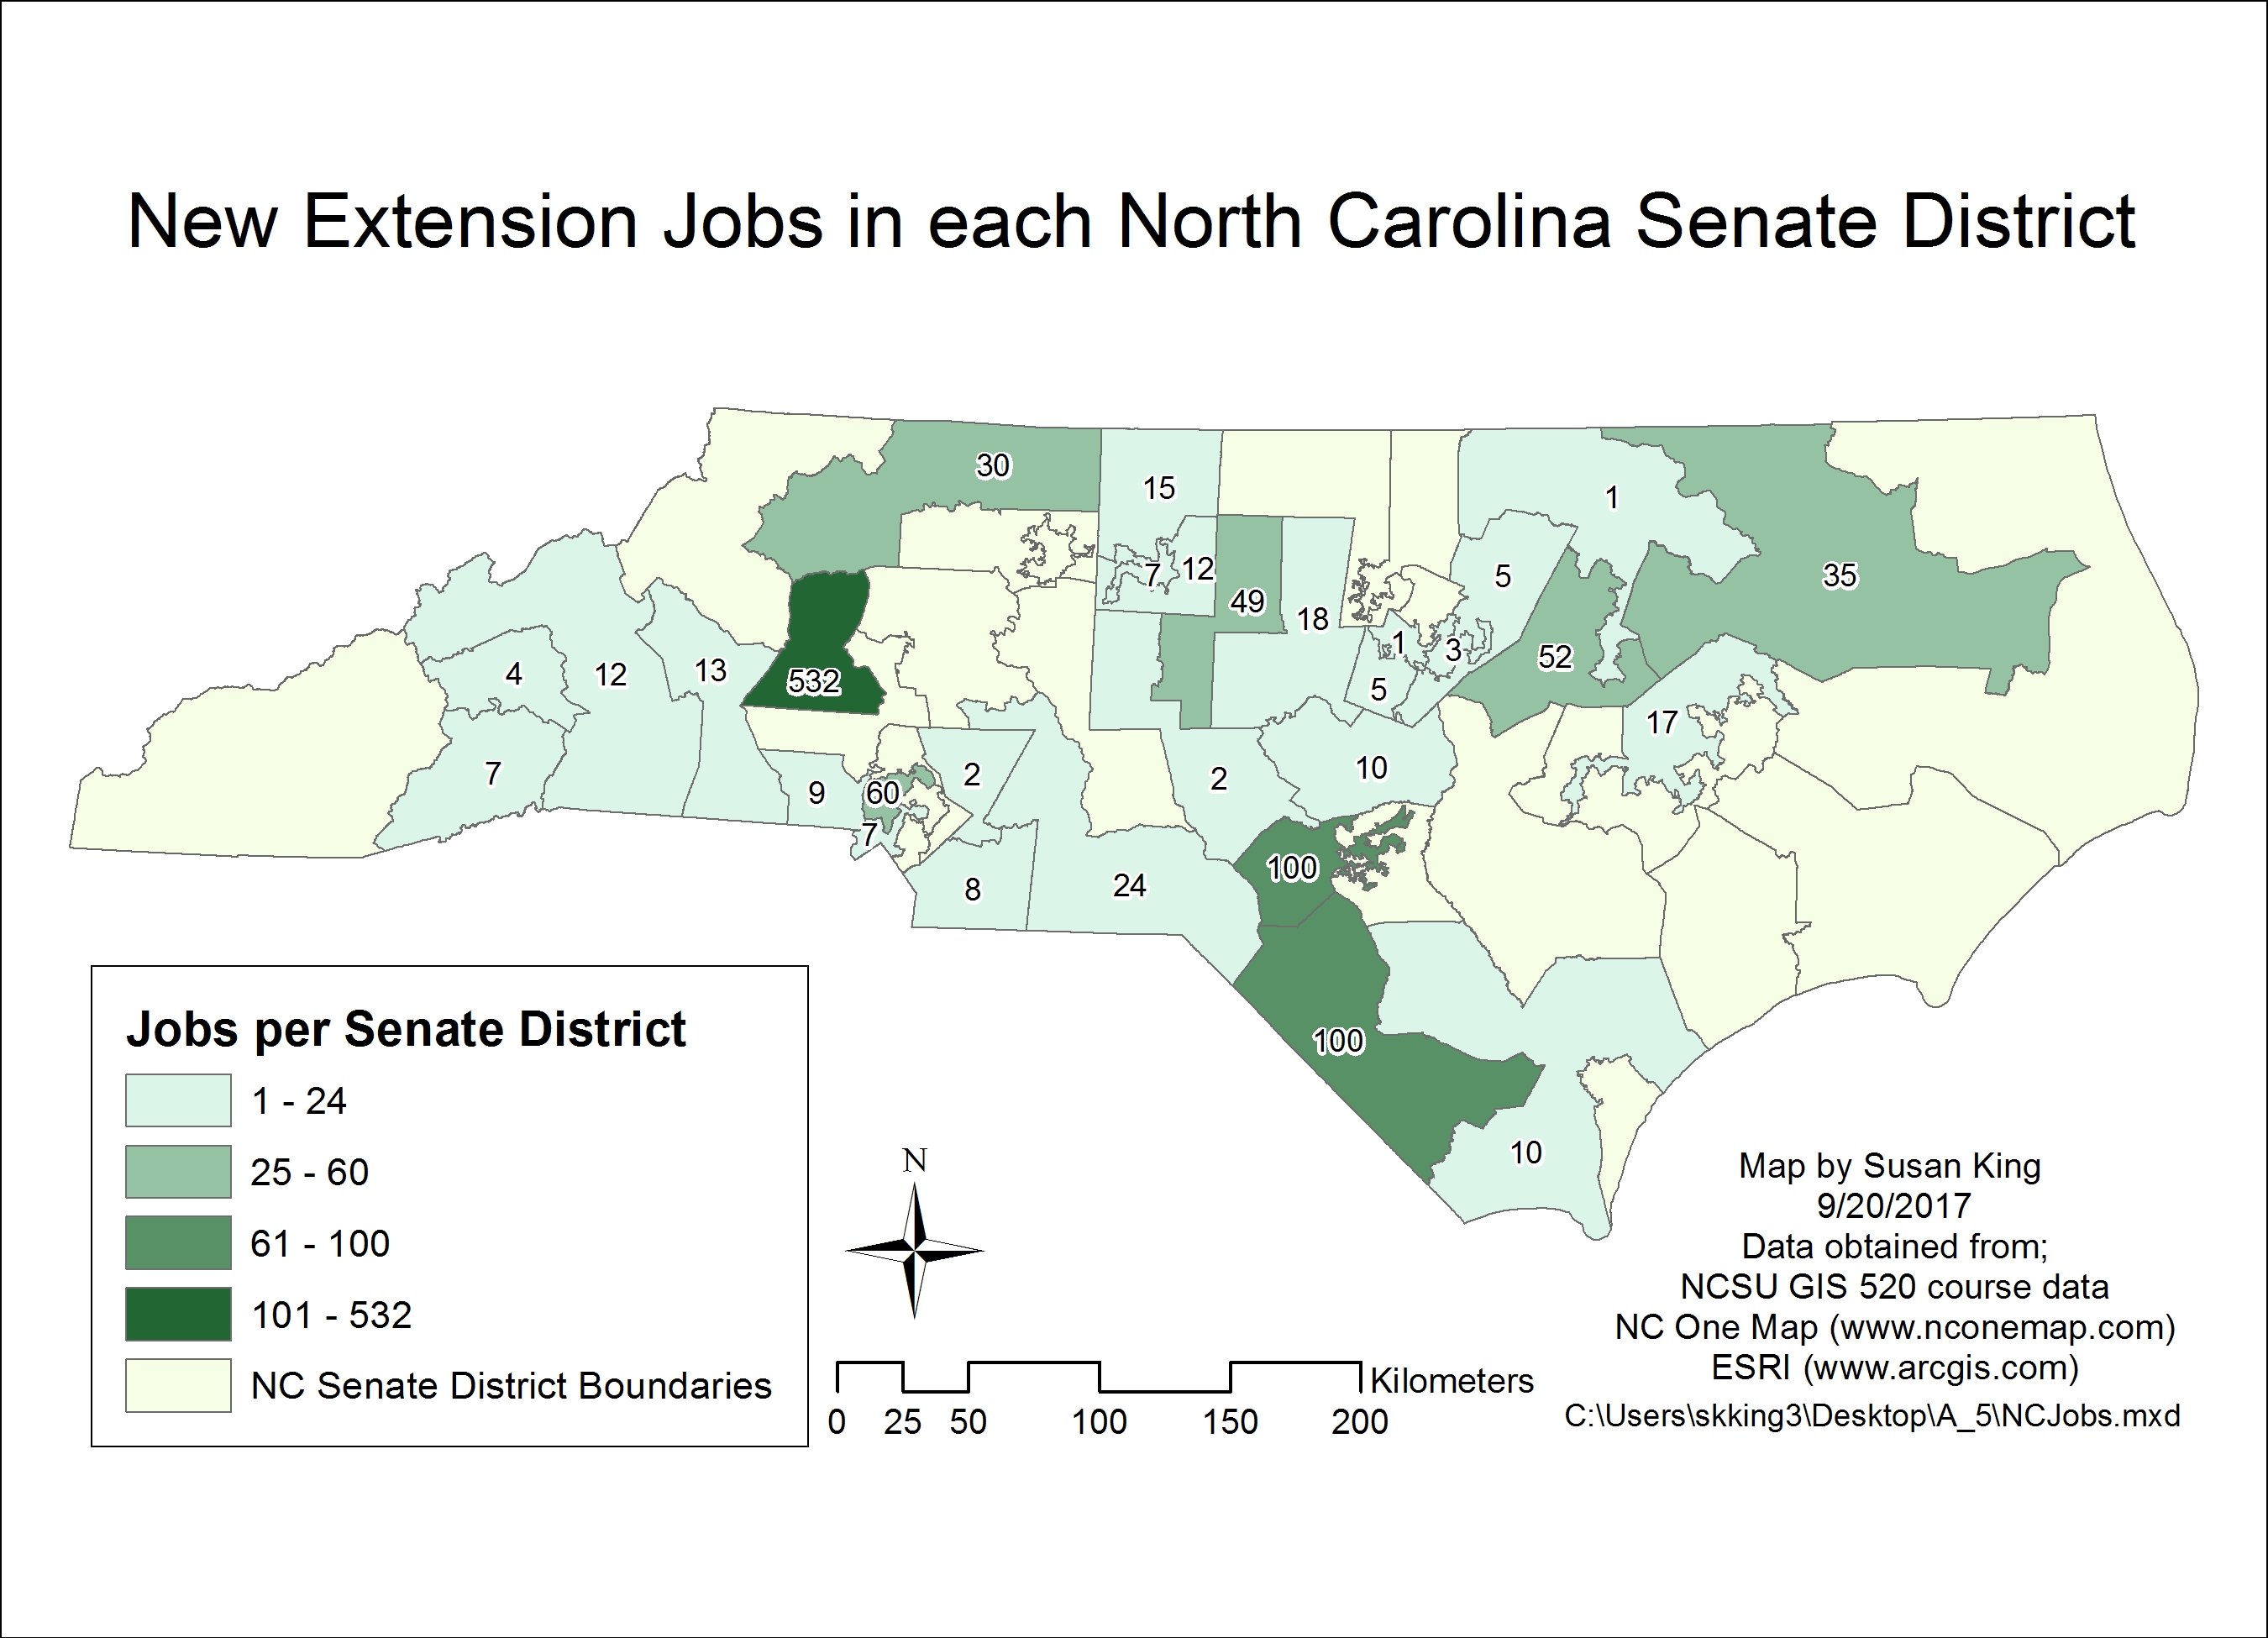
Fig. 2. Performing both a tabular and a spatial join allows data on jobs created per zip code to be displayed as jobs created per state congressional district. Click on each image to open larger version.
Application and Reflection: Being able to summarize and join data in various formats, and depict different variables across a variety of spatial formats is a very useful tool.
Problem Description: A wildlife biologist is asked to represent the bird species diversity across all the counties of the state, and to show the species diversity as it relates to different land cover types.
Data needed: The wildlife biologist had the results of bird surveys conducted throughout the state. These data are supplemented with data from the Breeding Bird Survey, available from the USGS’s Patuxent Wildlife Research Center and from Cornell Lab of Ornithology’s ebird site. The USGS also has data available on the land cover across the country. Shapefiles for the state’s county boundaries can be obtained from the local library.
Analysis Procedures: ArcMap provides the tools available to join this information either spatially or by a common field (attribute) in a table that would allow you to present this information. You could also use the summarize tool to either total counts, or depict the mean of repeated surveys. Previously, I used data from ebird to show the species diversity and number of times a species had been sighted at each location, but I had been unaware of the summarize tool in ArcMap and I used Excel to summarize the data before joining it to the spatial locations in ArcMap. It would have been much more efficient to perform this function within ArcMap.
Back to AutoCAD Integration Forward to Census Data
