Supervised Classification of Land Cover
Problem: You need to classify the land cover of one aerial image of the Black Water National Wildlife Refuge in order to develop a methodology for creating land cover data for the entire refuge. You need to identify the following six land cover classes: forest, cultivated field, barren area, developed/impervious, wetland, and water.
Analysis Procedures:
Strategies and Methods: I will use Arc Map (version 10.5.1) and its Spatial Analyst extension and Image Classification toolbar to perform this analysis, a Supervised Classification. The analysis will be performed using the provided raster image of the area obtained from a recent (August 2010) aerial photograph that was taken with a 1-foot resolution using four bands (true color and infrared).
To prepare the image for classification, I set the image display to a false-color composite (display bands 4,3,2). I selected approximately 25-35 training samples for each of the six desired classes of land cover and merged these into one appropriately named class (Fig. 1). These polygons were saved as a shapefile for communicating the results of the analysis. After the training samples were saved, an Interactive Supervised Classification was run on the image. The output raster was scrutinized to determine which cells were not correctly classified (using the false-color and true-color images for comparison), and the output was saved as a GRID file. This GRID file was used to calculate the area of each class of land cover to compare with the results after refining the classification using the count of cells, along with the cell size, to calculate area. I selected more training samples, focusing on the areas that were not correctly classified, and repeated the Interactive Supervised Classification. Again, I saved the appropriate files and calculated the area of the newly classified land cover classes. I made maps to show the training samples used and the final classified image. Because I was not happy with the results of the supervised classification, I repeated this process using fewer, larger training samples (Fig. 2 and Fig. 3).
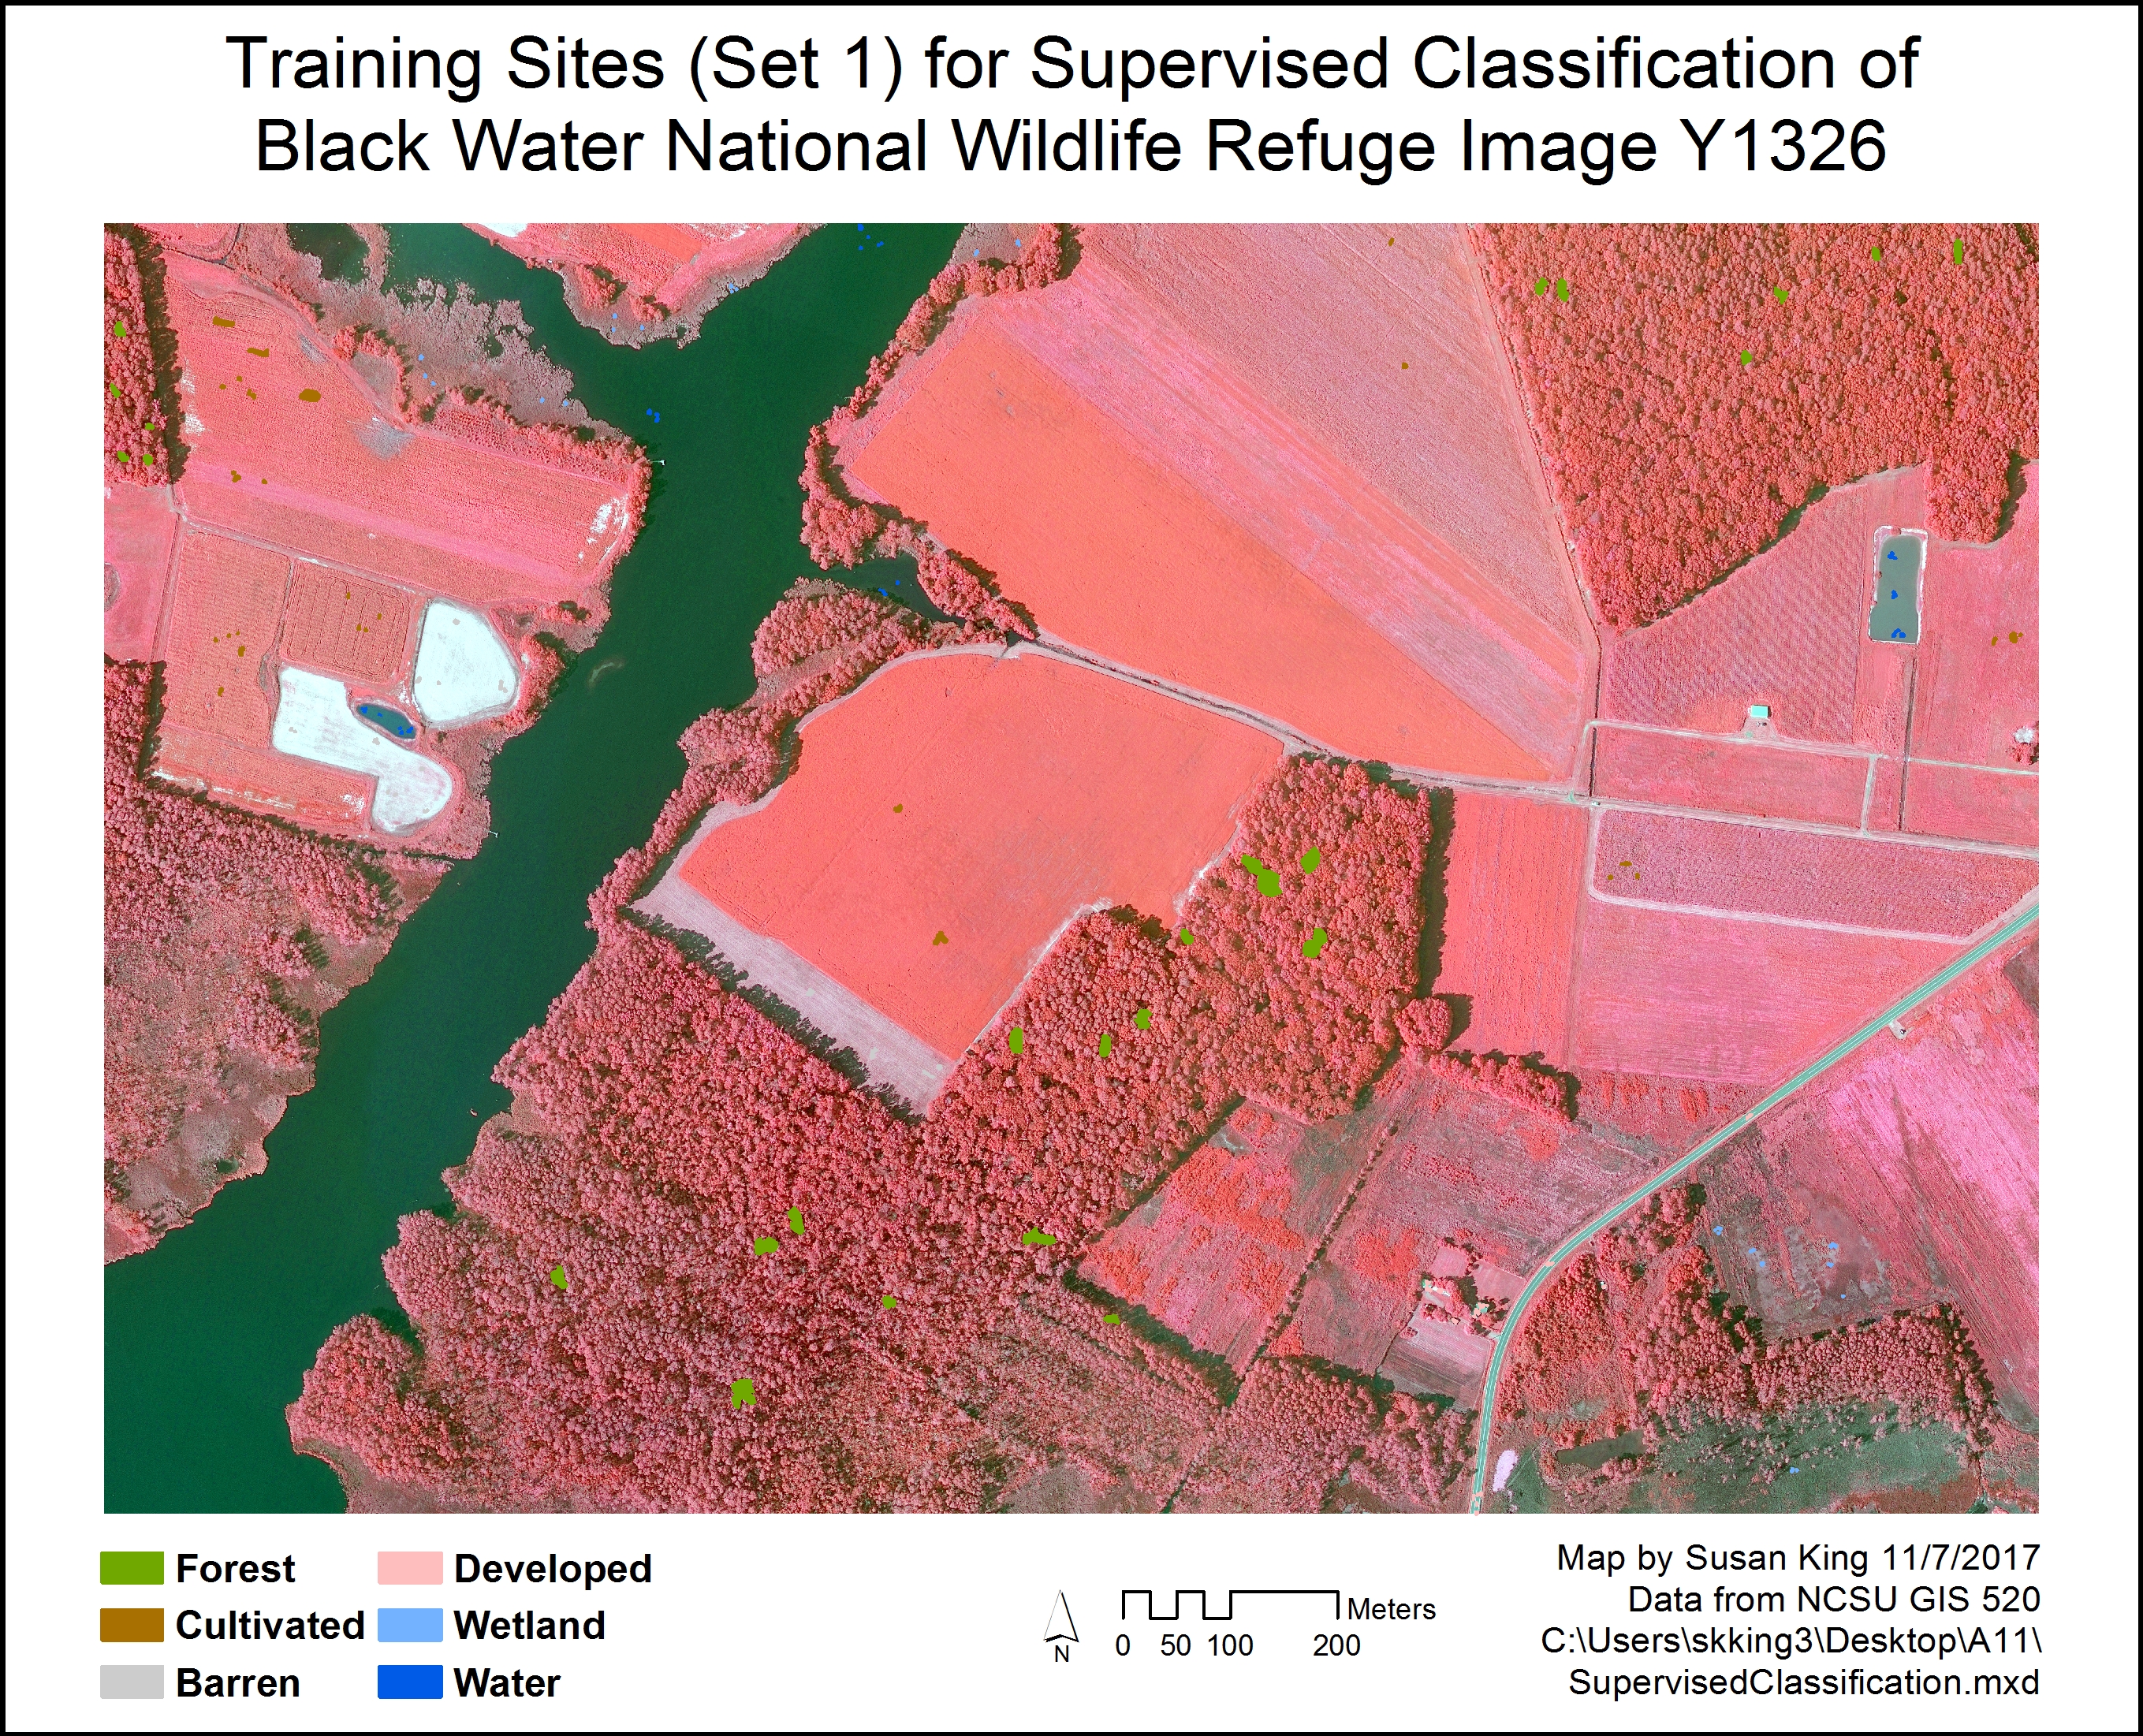

Fig. 1. Original training polygons (left/top) used to perform supervised classification and the follow-up set of training polygons (right/bottom) with additional training sites added from areas of misclassified land cover. Click on images for larger version.
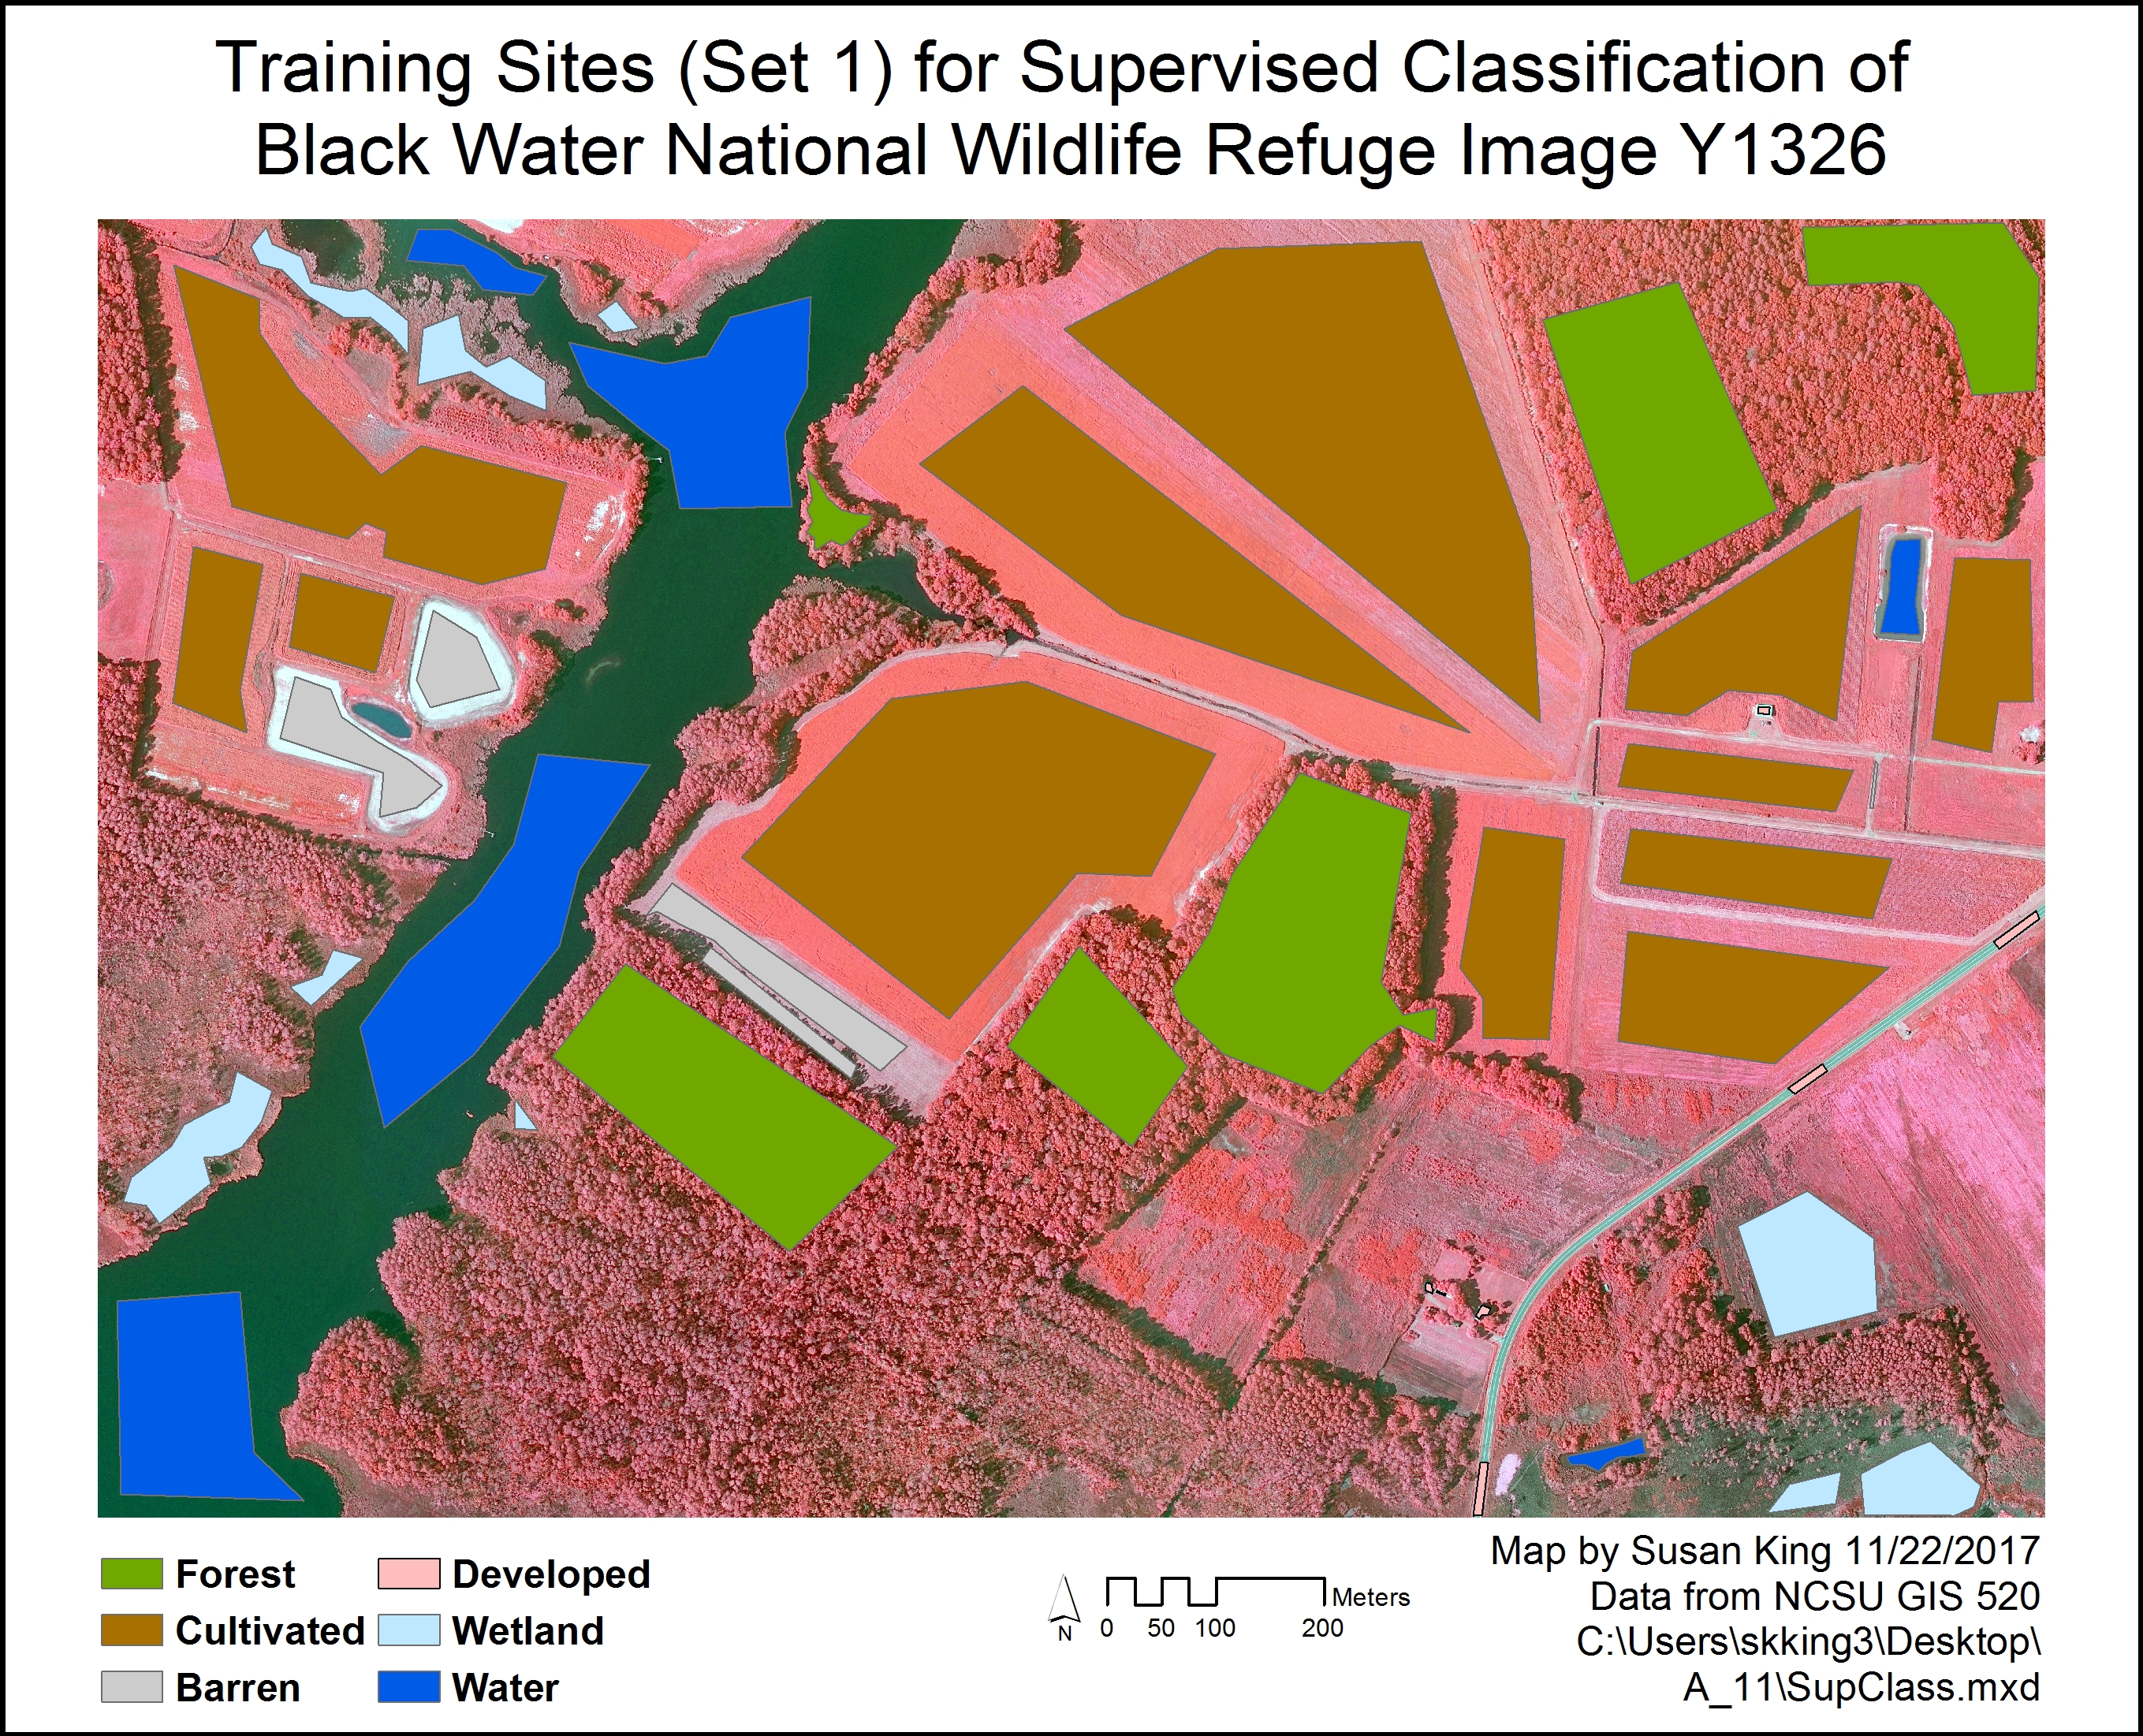

Fig. 2. Second trial of running supervised classification using much larger training polygons showing original set of training polygons (left/top) and follow-up set of training polygons (right/bottom) with additional training sites added from areas of misclassified land cover. Click on images for larger version.
Workflow Diagram:
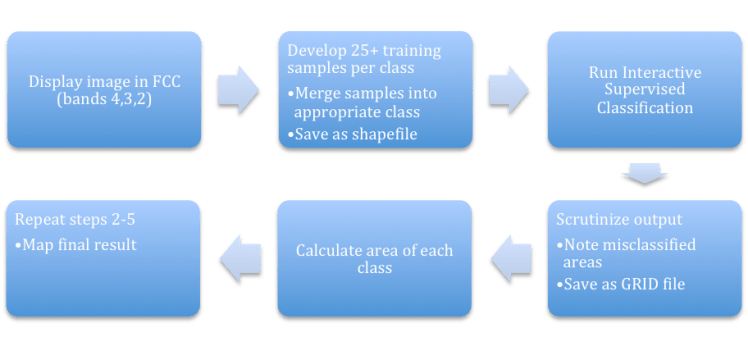
Fig. 3. Workflow diagram for performing supervised image classification.
Results: Supervised Classification results in an output layer that shows how each cell in the raster is classified based on the similarity to the cells used in the training samples. After the first classification, the cultivated cover was often misclassified as forest, but the forest was primarily classified correctly. Other cover types were occasionally misclassified also, but these classifications improved slightly after adding additional training samples (Fig. 4). The area of each type of cover changed slightly between both classifications (Table 1). The second trial, using fewer larger training samples, resulted in far more cultivated land being properly classified, but unfortunately, there was also more forest area misclassified as cultivated, even after adding additional training polygons for the misclassified areas (Fig. 5). The area of each type of cover changed slightly between both classifications (Table 2).
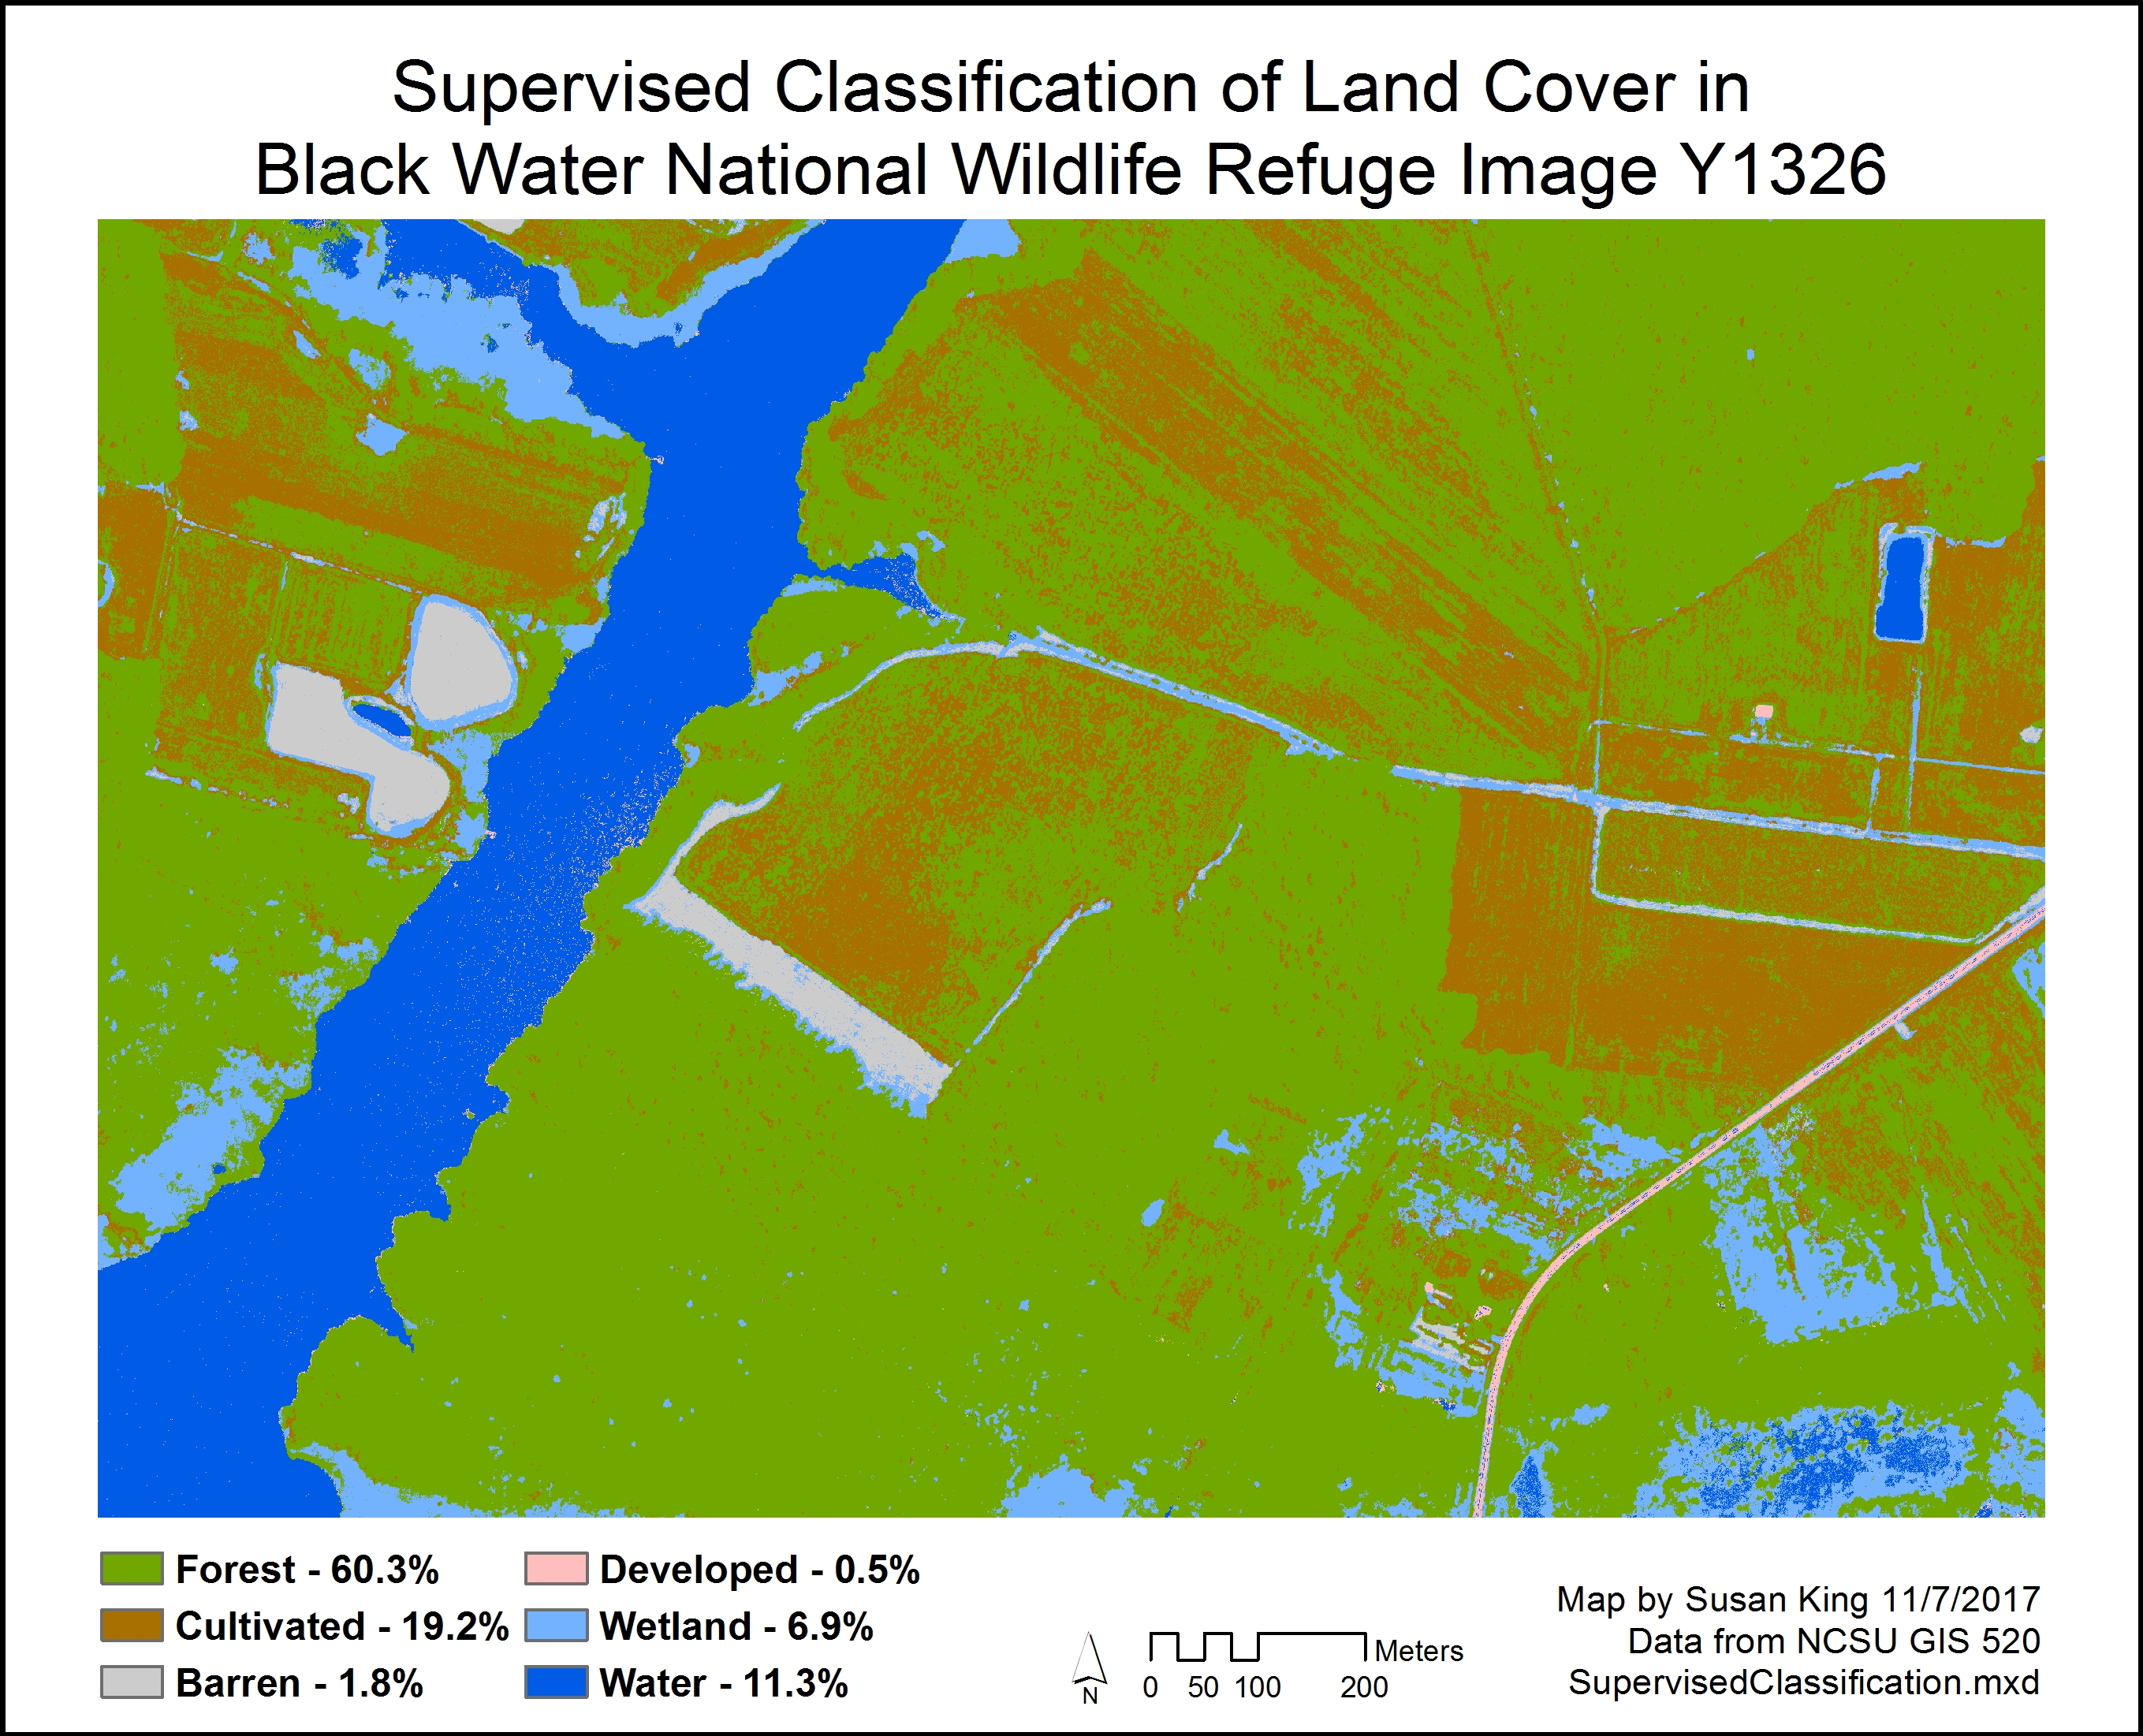
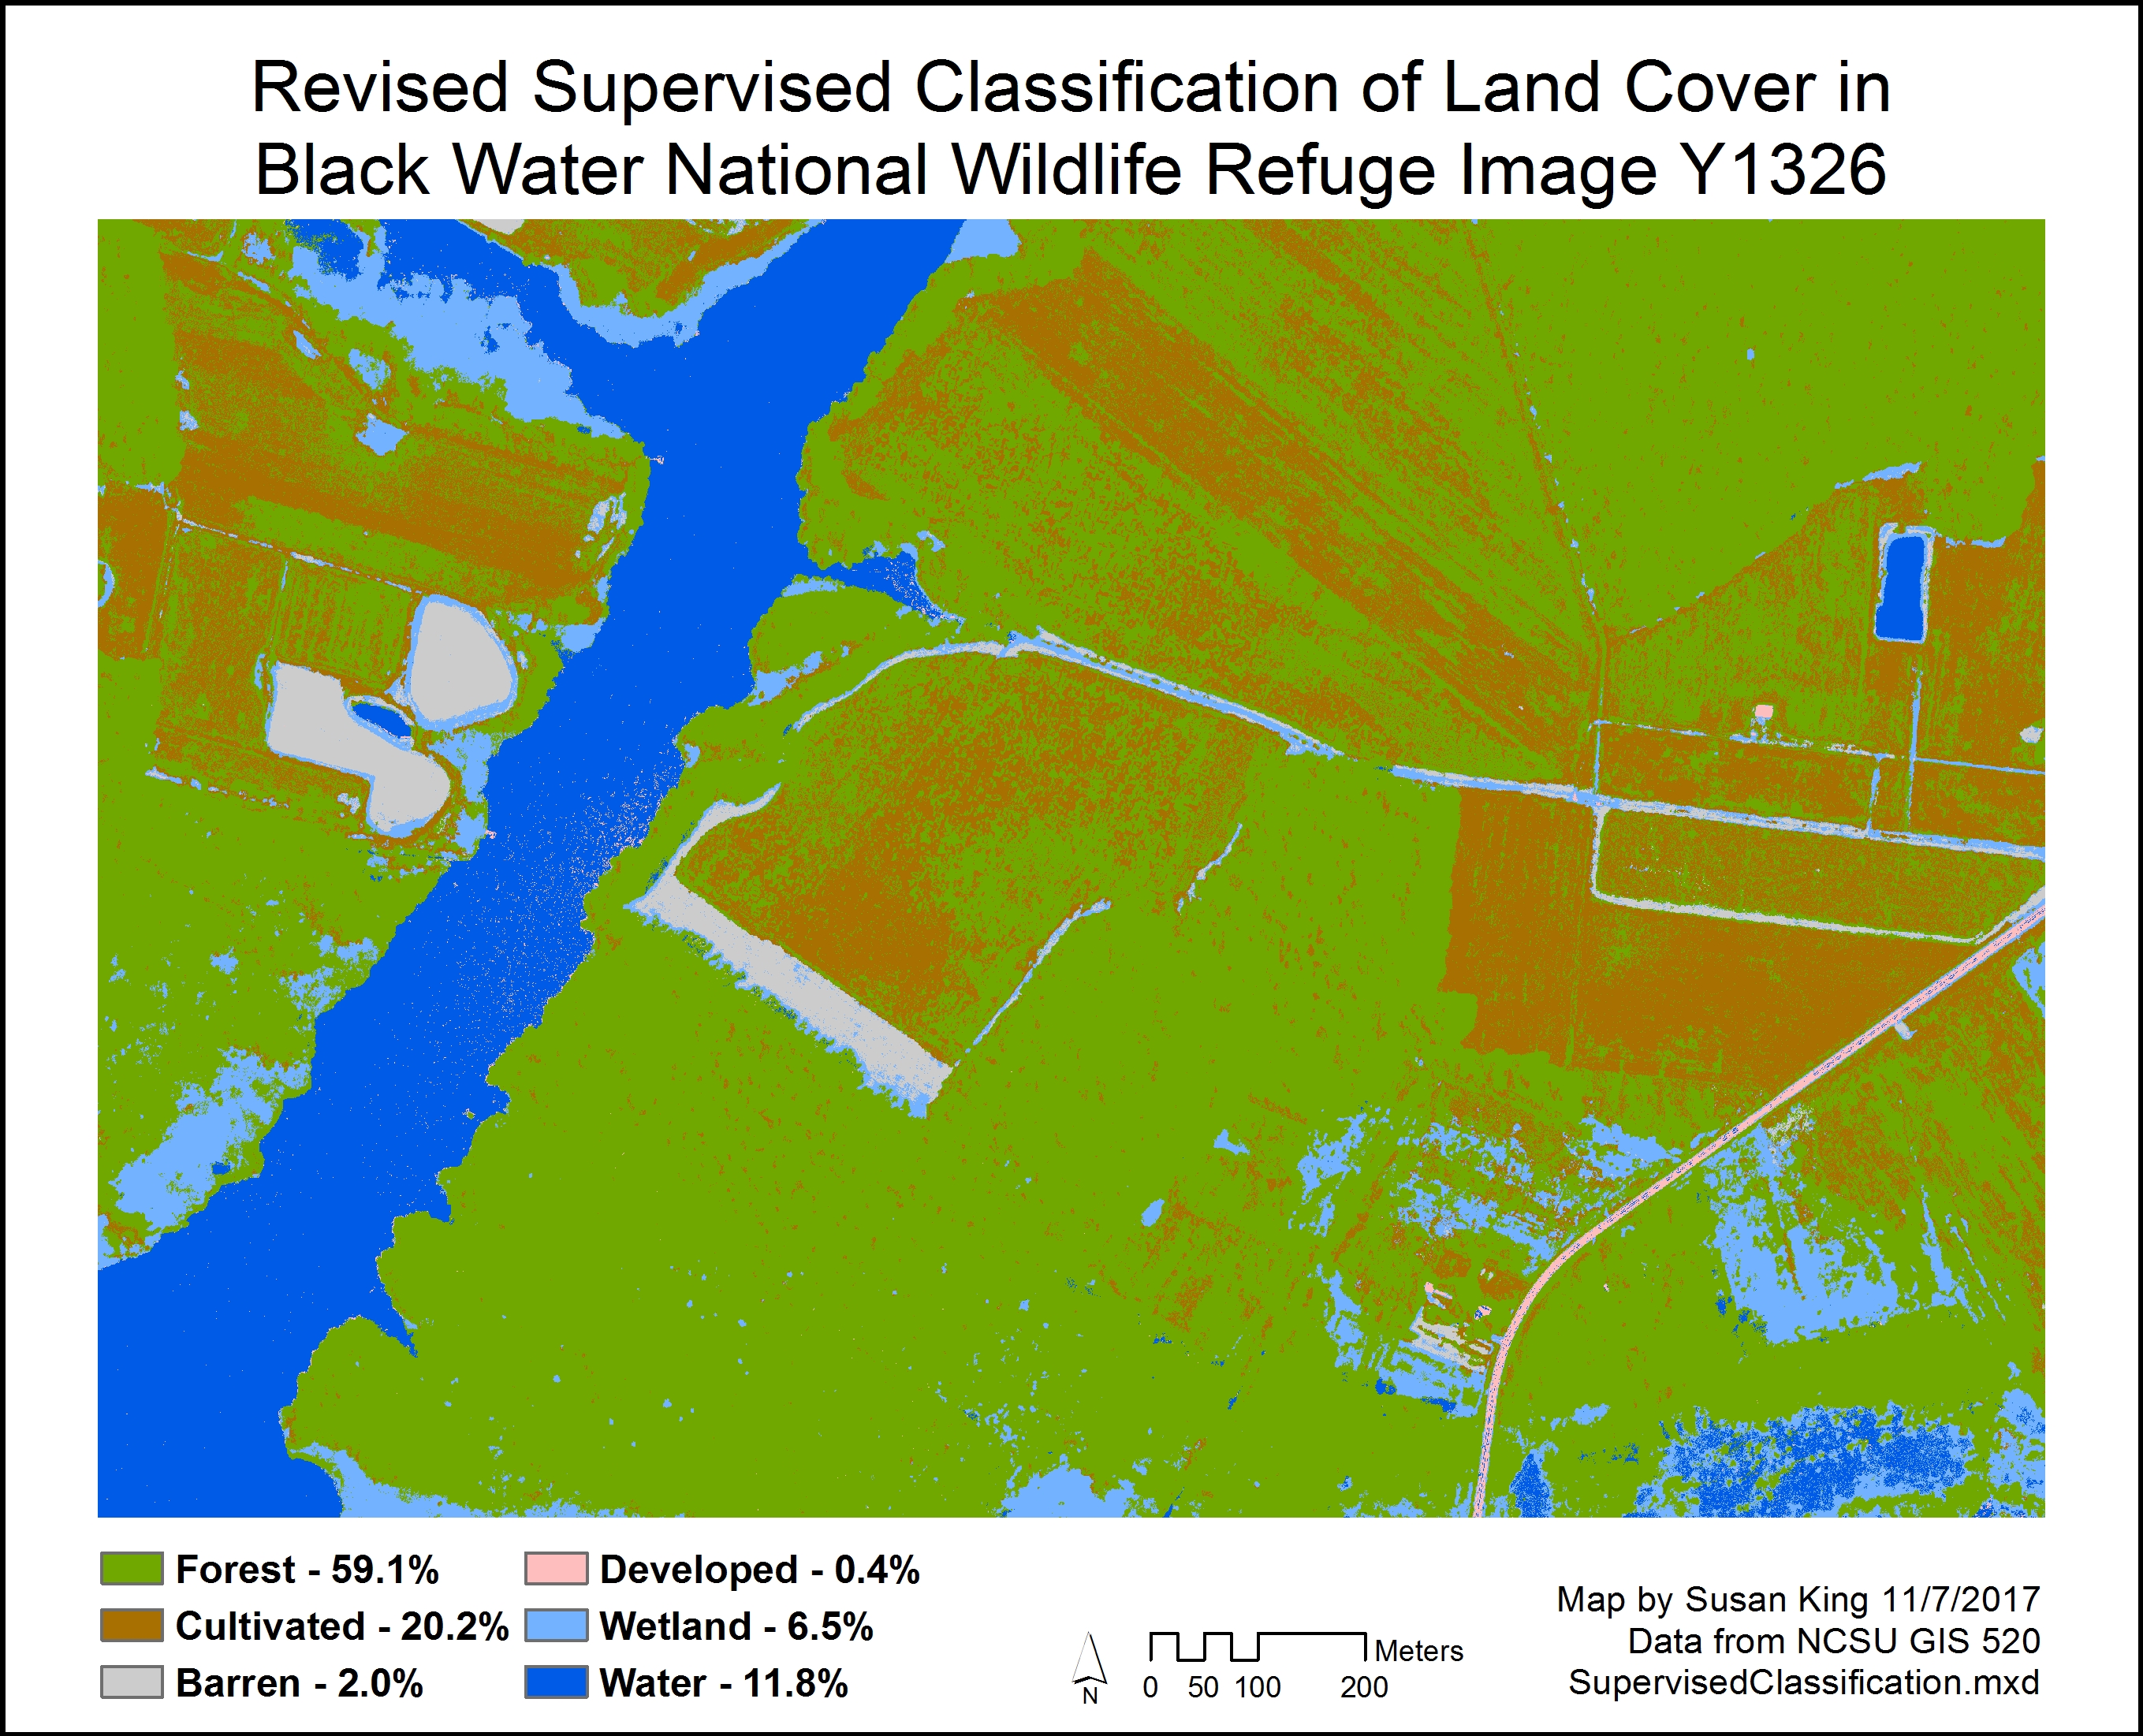
Fig. 4. Original output of supervised classification using many small training samples (left/top) and revised output after adding additional training samples to areas of misclassified cover (right/bottom). Click on images for larger version.
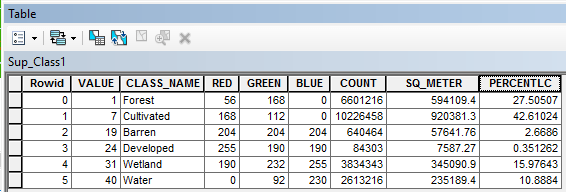
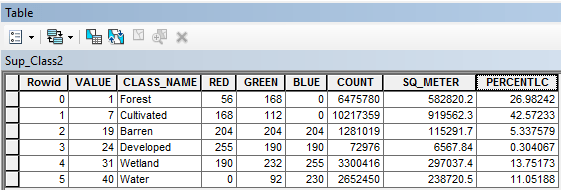
Table 1. Attribute tables showing the area (AREA_SQ_METER) and percent of total land cover (PERCENT_LC) for each class of land cover from the first supervised classification (top) and revised supervised classification (bottom).
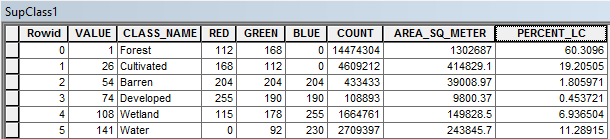
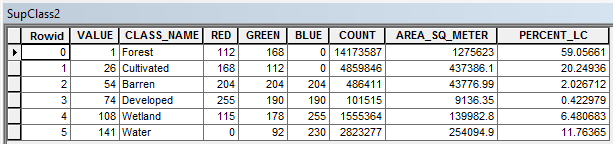
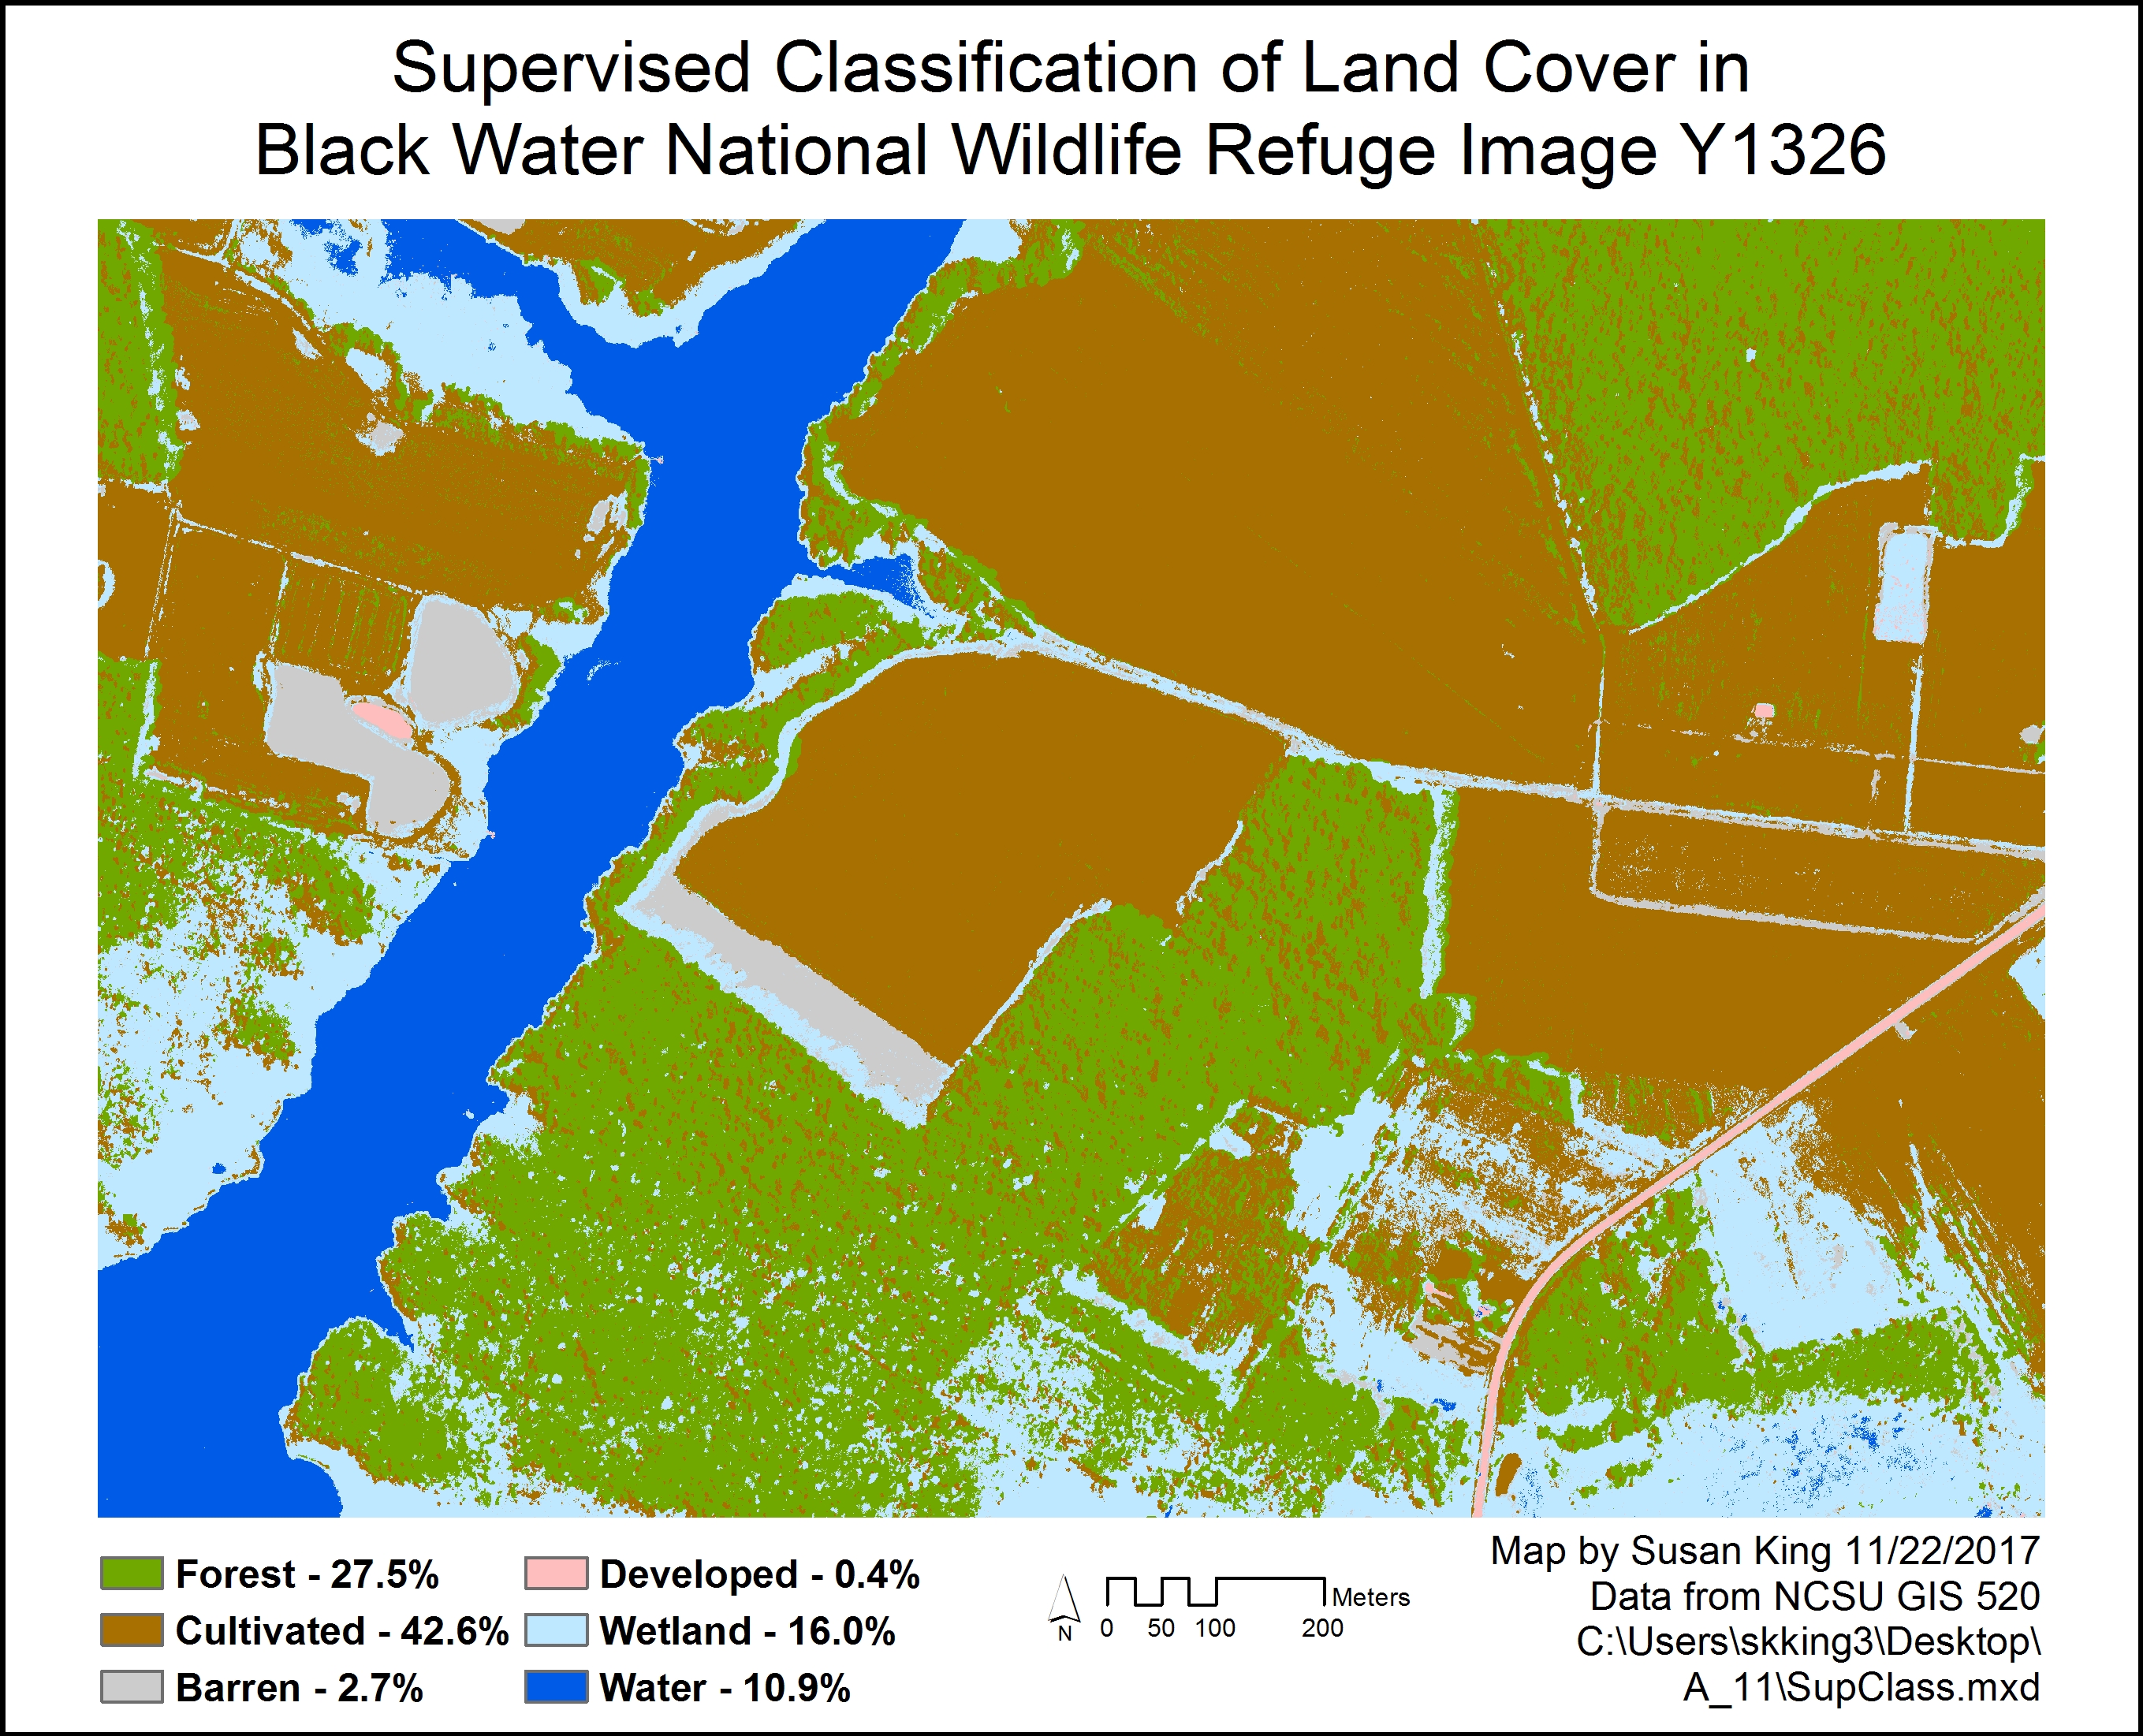
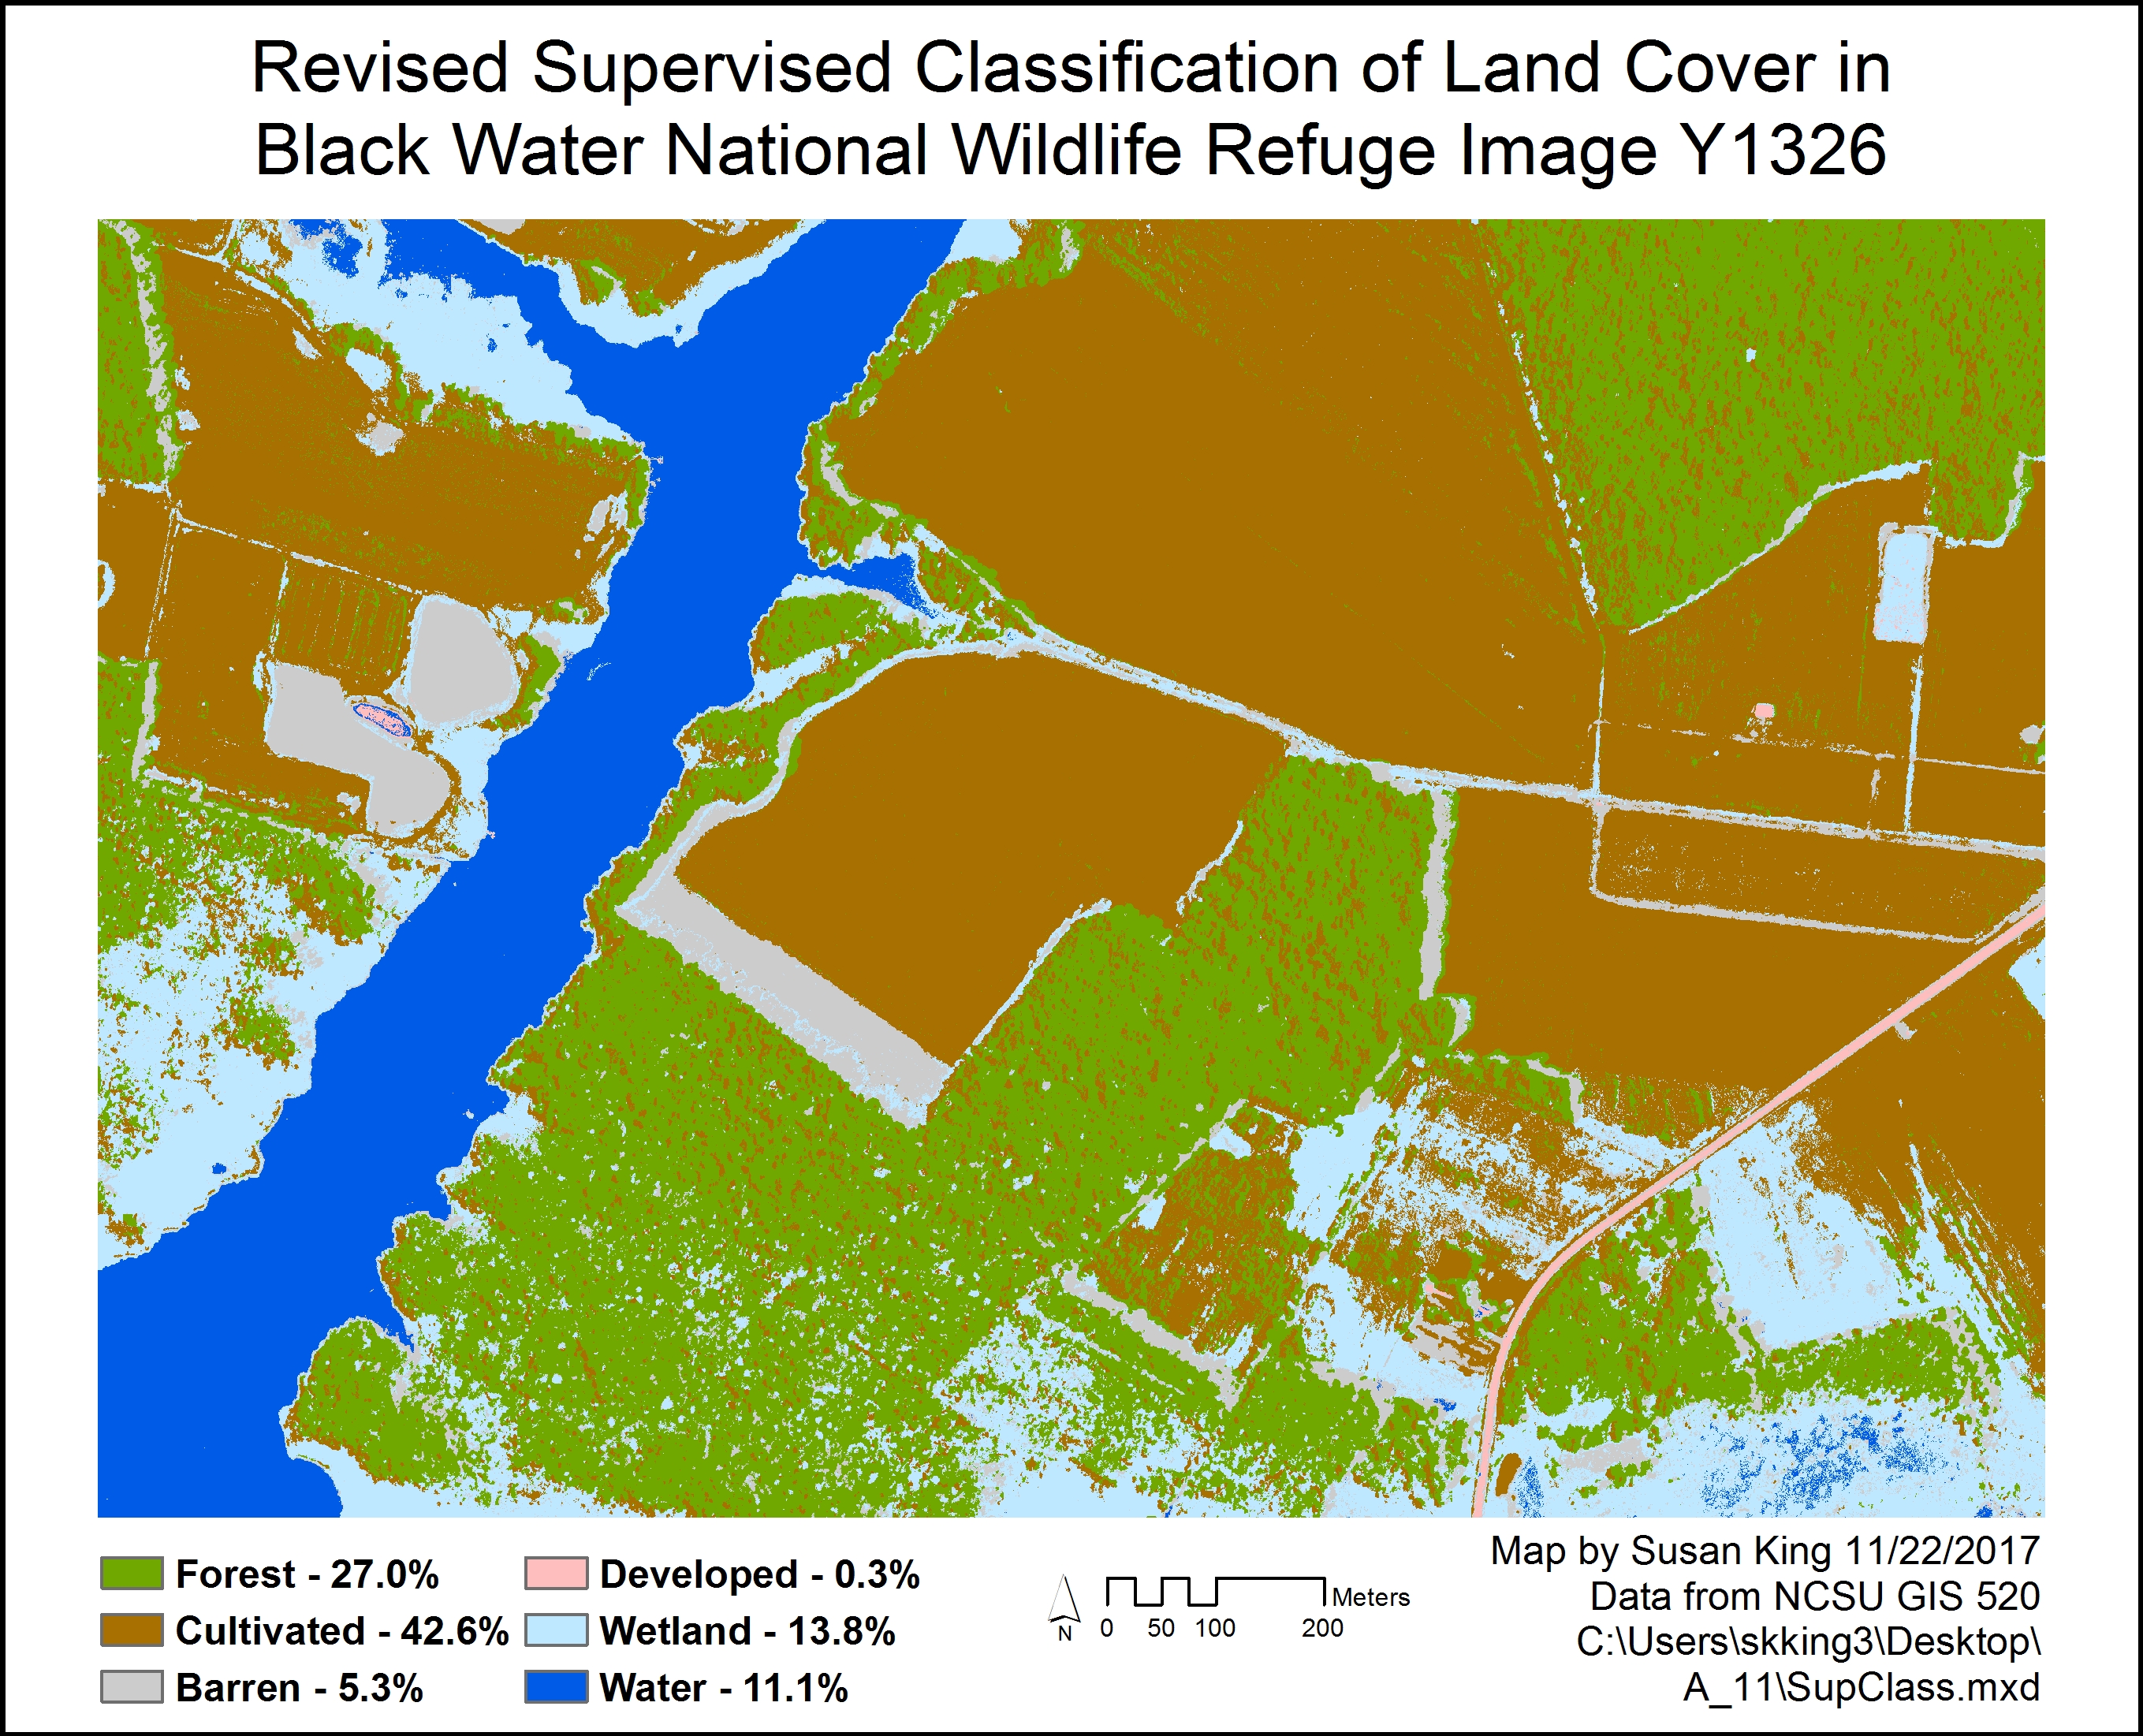
Fig. 5. Output of supervised classification using few large training samples (right/top) and revised output after adding additional training samples to areas of misclassified cover (left/bottom). Click on images for larger version.
Table 2. Attribute tables showing the area (SQ_METER) and percent of total land cover (PERCENTLC) for each class of land cover from the follow-up supervised classification (top) and revised supervised classification (bottom).
Application and Reflection: Image classification is a very useful technique that can be applied to a variety of land management and stewardship goals. When you have some familiarity with the area, and can thus select training sites of known land cover types, Supervised Classification is an appropriate technique to use.
Problem Description: Wildlife biologists wish to determine if certain management techniques are having a positive affect on an endangered species of wildlife. Specifically, they want to understand how forest management techniques have impacted the population of gopher tortoises.
Data needed: Results of gopher tortoise population surveys conducted over the years in the area of interest, available from the Wildlife Resources Commission. Satellite or aerial imagery of the study area, also collected over a period of years, are also needed. These images are often freely available through USGS’s Earth Explorer site.
Analysis Procedures: Use Supervised Classification to classify the images to determine the area of each type of land cover in your study area. Comparing the output, and the area of each type of land cover class, to the population of gopher tortoises in each area and at different times, to determine which management techniques were having a positive affect on the gopher tortoise population.
Esri Certificate (click on image for larger version):
Back to Weighted Overlay Forward to Customizing ArcMap
