Using Fuzzy Logic to Model Bald Eagle Habitats
Problem: You are a wildlife biologist trying to locate the most suitable habitat for Bald Eagles. The following criteria will be used to locate suitable habitat using a fuzzy logic method: 1) Far from human disturbances, such as roads, power lines, cities. 2) Close to water. 3) Not too densely or sparsely covered by forest—usually between 40 percent and 70 percent tree cover.
Analysis Procedures:
Strategies and Methods: You have raster data on the level of human disturbance and land cover classification. Using ArcMap (version 10.5.1), an Euclidean Distance tool was run on the raster layers to produce layers for the distance from human disturbance and the distance to water. The land cover raster was reclassified on the basis of tree cover on a 1 to 9 scale. I ran the Fuzzy Membership tool to assign fuzzy membership for the distance to water layer, so that small values (close to the water) were assigned high membership. I assigned fuzzy membership to the distance to human disturbance such that areas near humans had high values. For the tree cover, I assigned high fuzzy membership to areas with a mid-range of tree cover, with either extreme being assigned low values. I performed a Fuzzy Overlay, setting the properties such that all three criteria must be met to be assigned a high membership (Fig. 1).
Workflow Diagram:

Fig. 1. Workflow diagram for selecting suitable habitat with fuzzy logic.
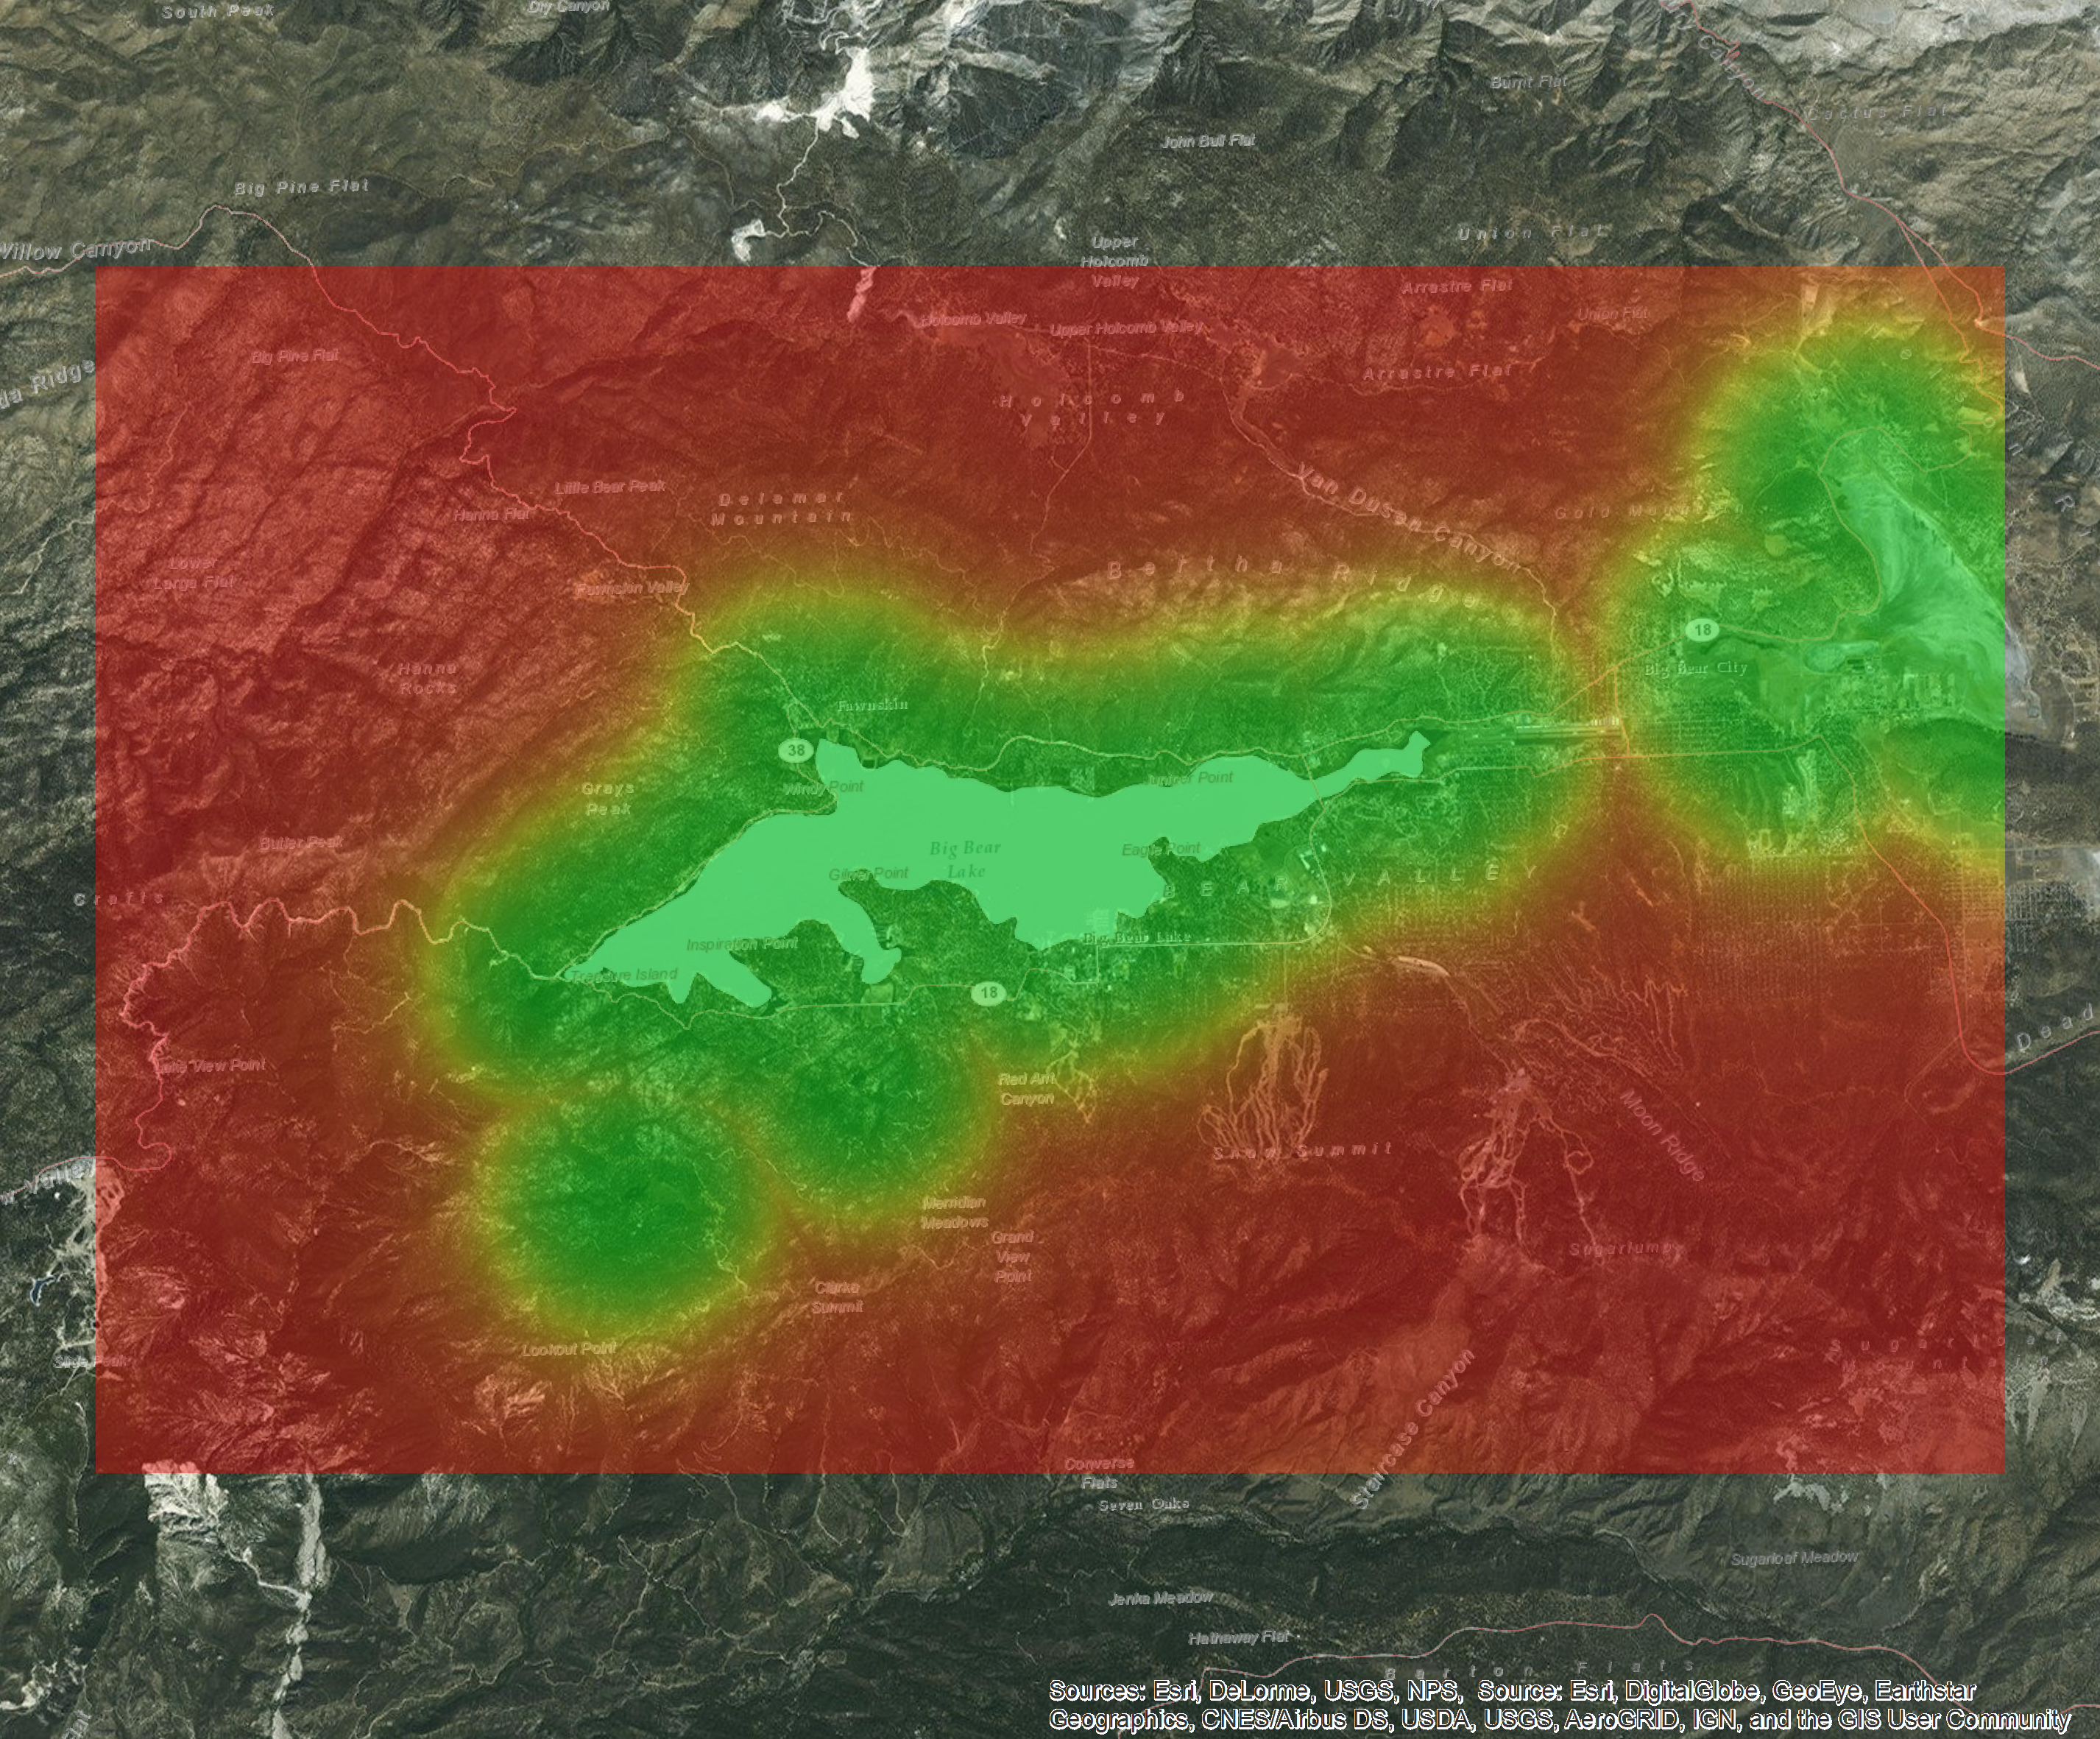
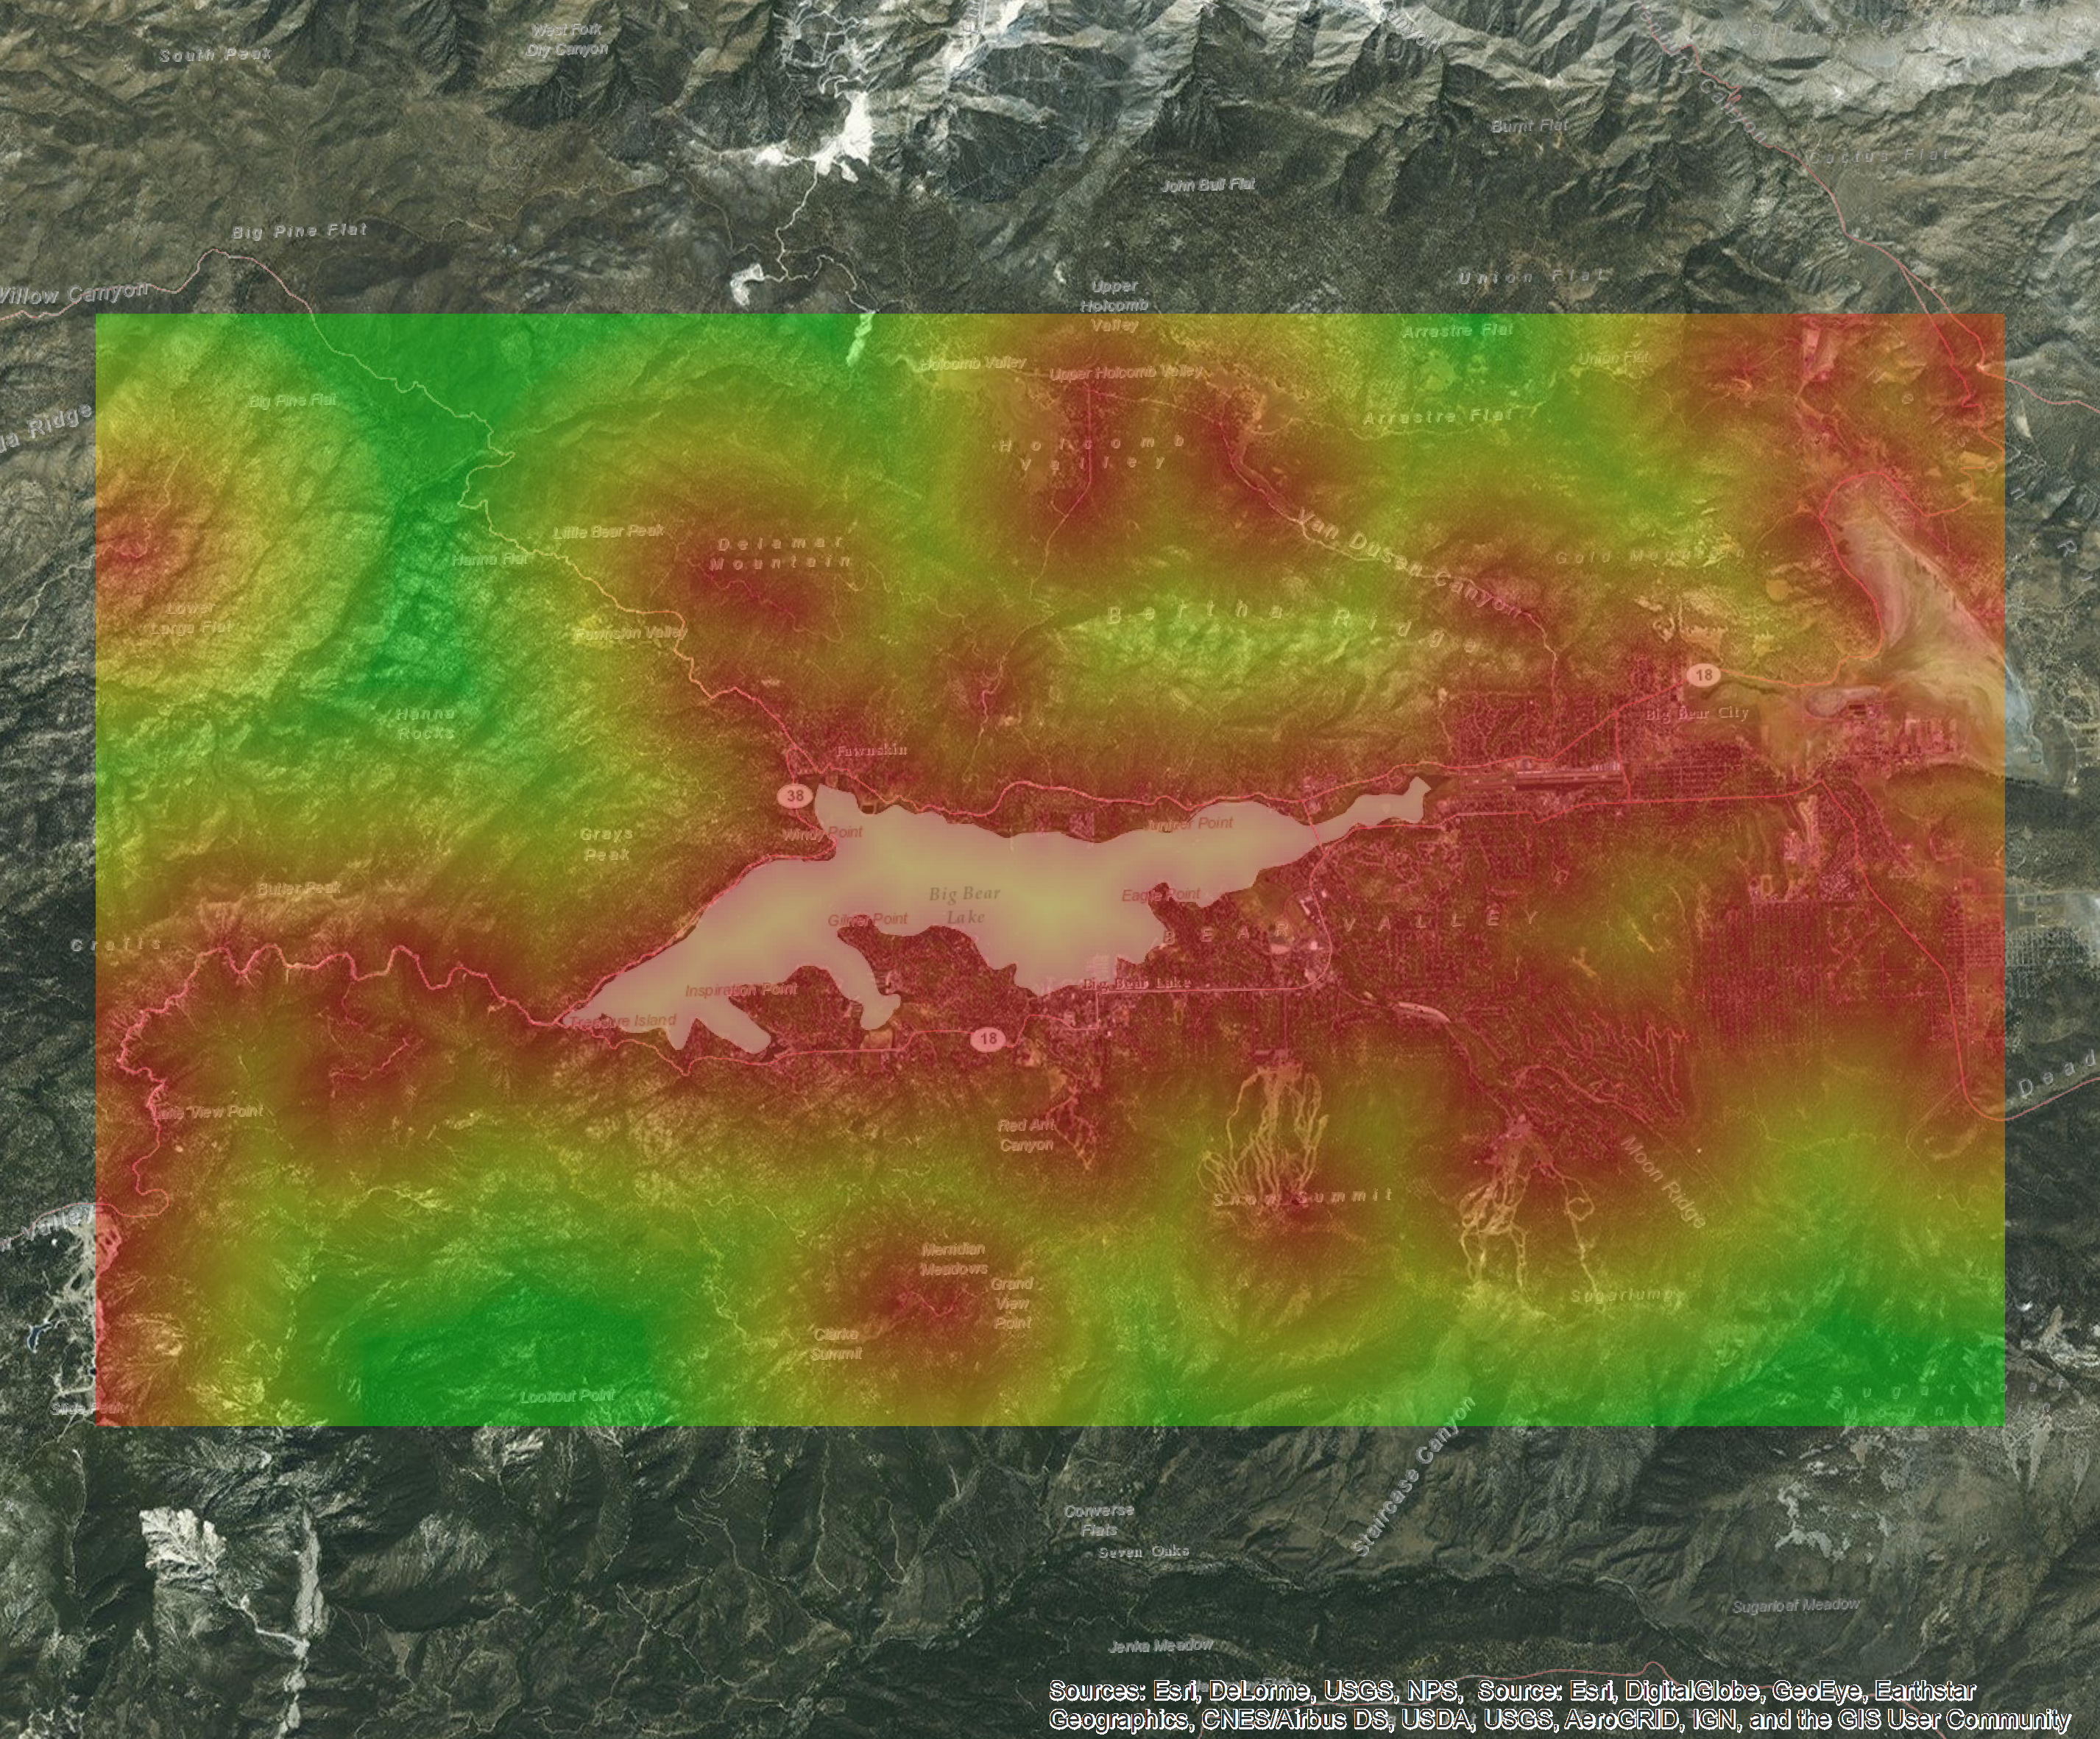
Fig. 2. Example of raster output from the Fuzzy Membership tool depicting the distance from the lake (left/top) with higher value (green) assigned to areas closer to the water, distance from humans (right/bottom) with areas closer to distances (red) assigned lower value. Click on each image for larger version.
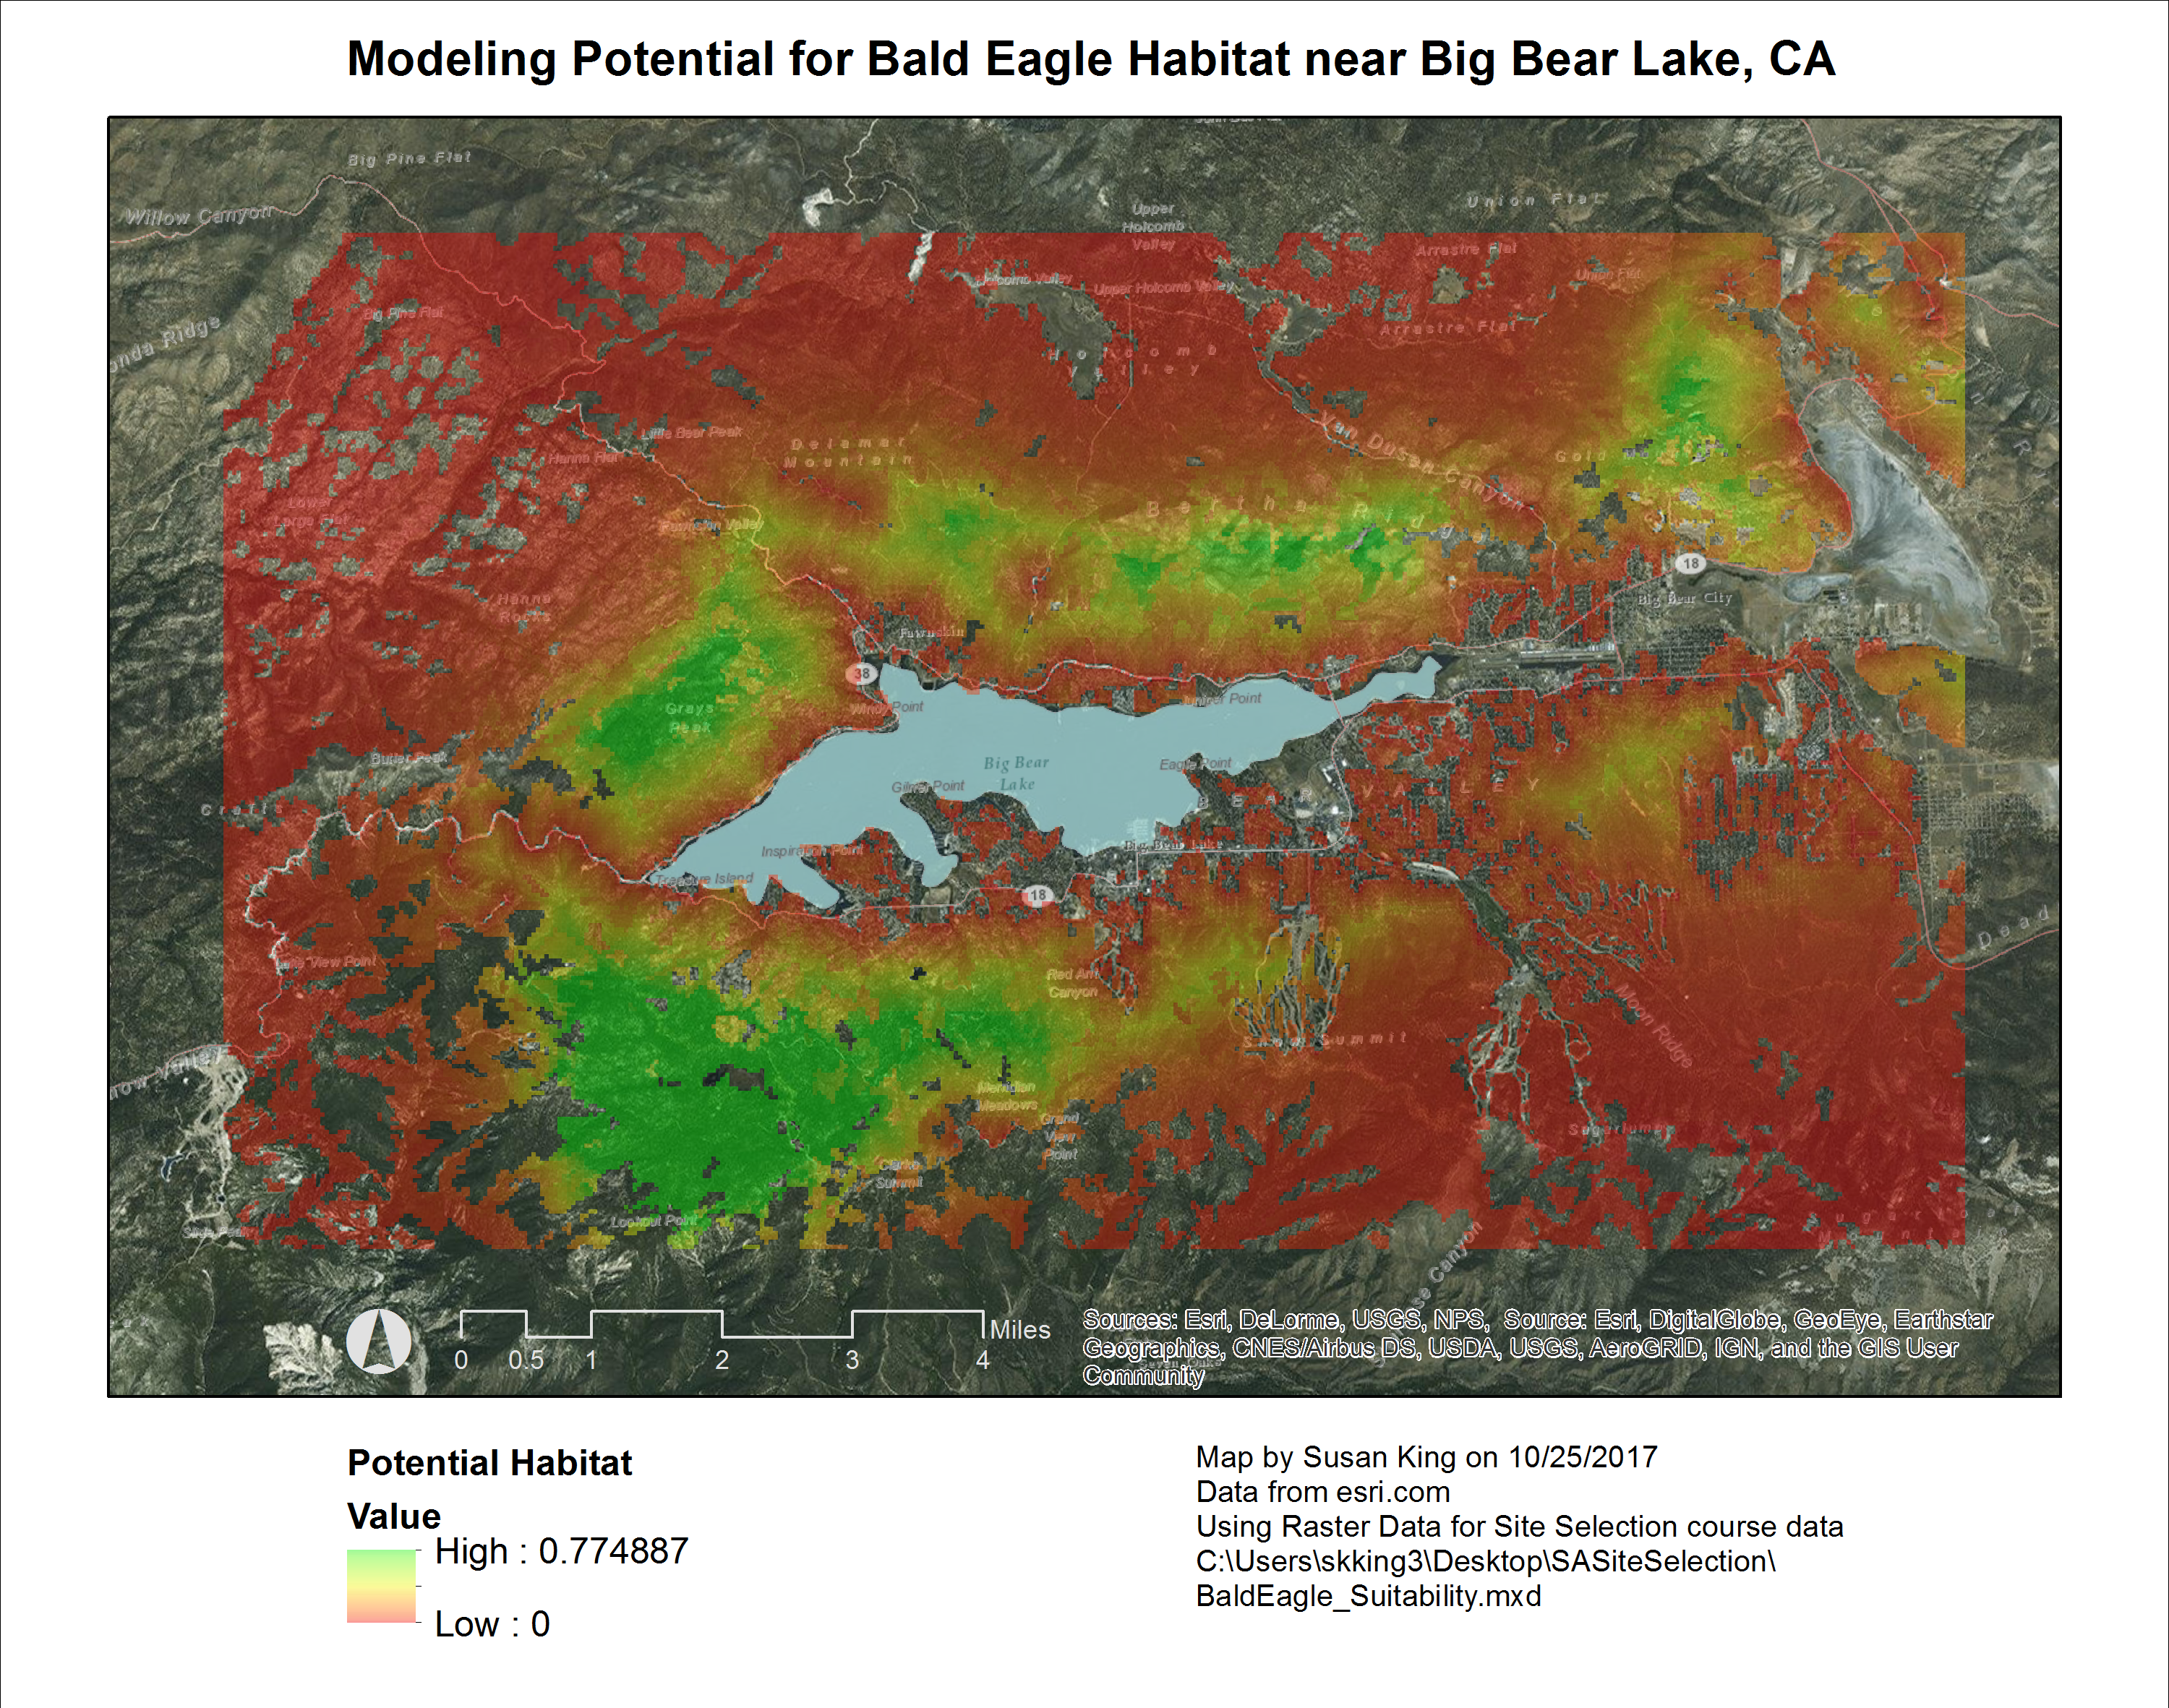 Figure 3. Result of Fuzzy Overlay of three input variables. High values (green) depict the most suitable habitat for Bald Eagles based on being in areas close to water, far from human disturbance, and in medium tree cover. Click on image for larger version.
Application and Reflection: Fuzzy Overlay to perform site selection is a powerful tool with many applications in ecology.
Problem Description: You are studying the ecology of the invasive Cane Toad and need to understand which habitat that has not yet been invaded is most suitable so that you can focus your efforts on preventing Cane Toads from colonizing these areas.
Data needed: You have raster data on land cover, agricultural crops, and environmental conditions (temperature and rainfall) that was obtained from CSIRO, Australia.
Analysis Procedures: Reclassify the data so transform the values of each layer so they are all on the same scale. Run the fuzzy membership tool to transform the data based on the possibility that it meets the criteria you set. You will assign high values to sugar cane fields and areas near water. Areas with middle temperature and higher rainfall will also be assigned higher values. Next, run the Fuzzy Overlay tool to determine which areas meet all your criteria. These are areas that are more likely to be suitable for the Cane Toads, and thus monitoring and eradication efforts should be focused here.
Esri Certificate (click on image for larger version):

