Suitability Analysis and Weighted Overlay
Problem: I have been tasked with locating suitable habitat for Black Bears in the Great Smoky Mountains National Park, so that wildlife biologists can relocate bears that have come into contact with humans with the goal of reducing future human-bear interactions.
Analysis Procedures:
Strategies and Methods: I have been provided data that includes elevation (raster format), classified vegetation, roads, trails, and streams (vector format). The relationship between each variable and the preference that Black Bears have shown towards that variable has also been provided. I performed this analysis using the Model Builder feature so that the tool can easily be re-run using different settings if desired in the future. I used the Slope tool with the output measure of degree to find the slope within the study area by inputting the elevation raster into the tool. The output from this tool was reclassified using the Reclassify tool and setting the parameters to match the bear’s three levels of preference. I used the Euclidean Distance tool to determine distances surrounding each of the roads, trails, and streams layers and then used the Reclassify tool to again match the bear’s three levels of preference. Next, I used the Feature to Raster tool to convert the vegetation layer to a raster so that it could be reclassified according to the preference levels of the bear that were given. The five reclassified layers were then input into the Weighted Overlay tool, with equal weights assigned. An Evaluation Scale of 1 to 3 by 1 was used because each layer had been reclassified to three levels of preference (Fig. 1). The final output represented the suitability of the area as bear habitat, and a map was created to communicate the results.
Workflow Diagram:
 Fig. 1. Workflow model for performing weighted overlay.
Results: The output of the reclassify tool on the transformed data is a new layer with the most favorable habitat is given a new value of three, favorable habitat is given a new value of two, and least favorable habitat is given a value of one. The weighted overlay computes new values for each cell based on computations run on all of the layers according the chosen settings. The results can be mapped to show how well each cell meets the combination of criteria set (Fig. 2).
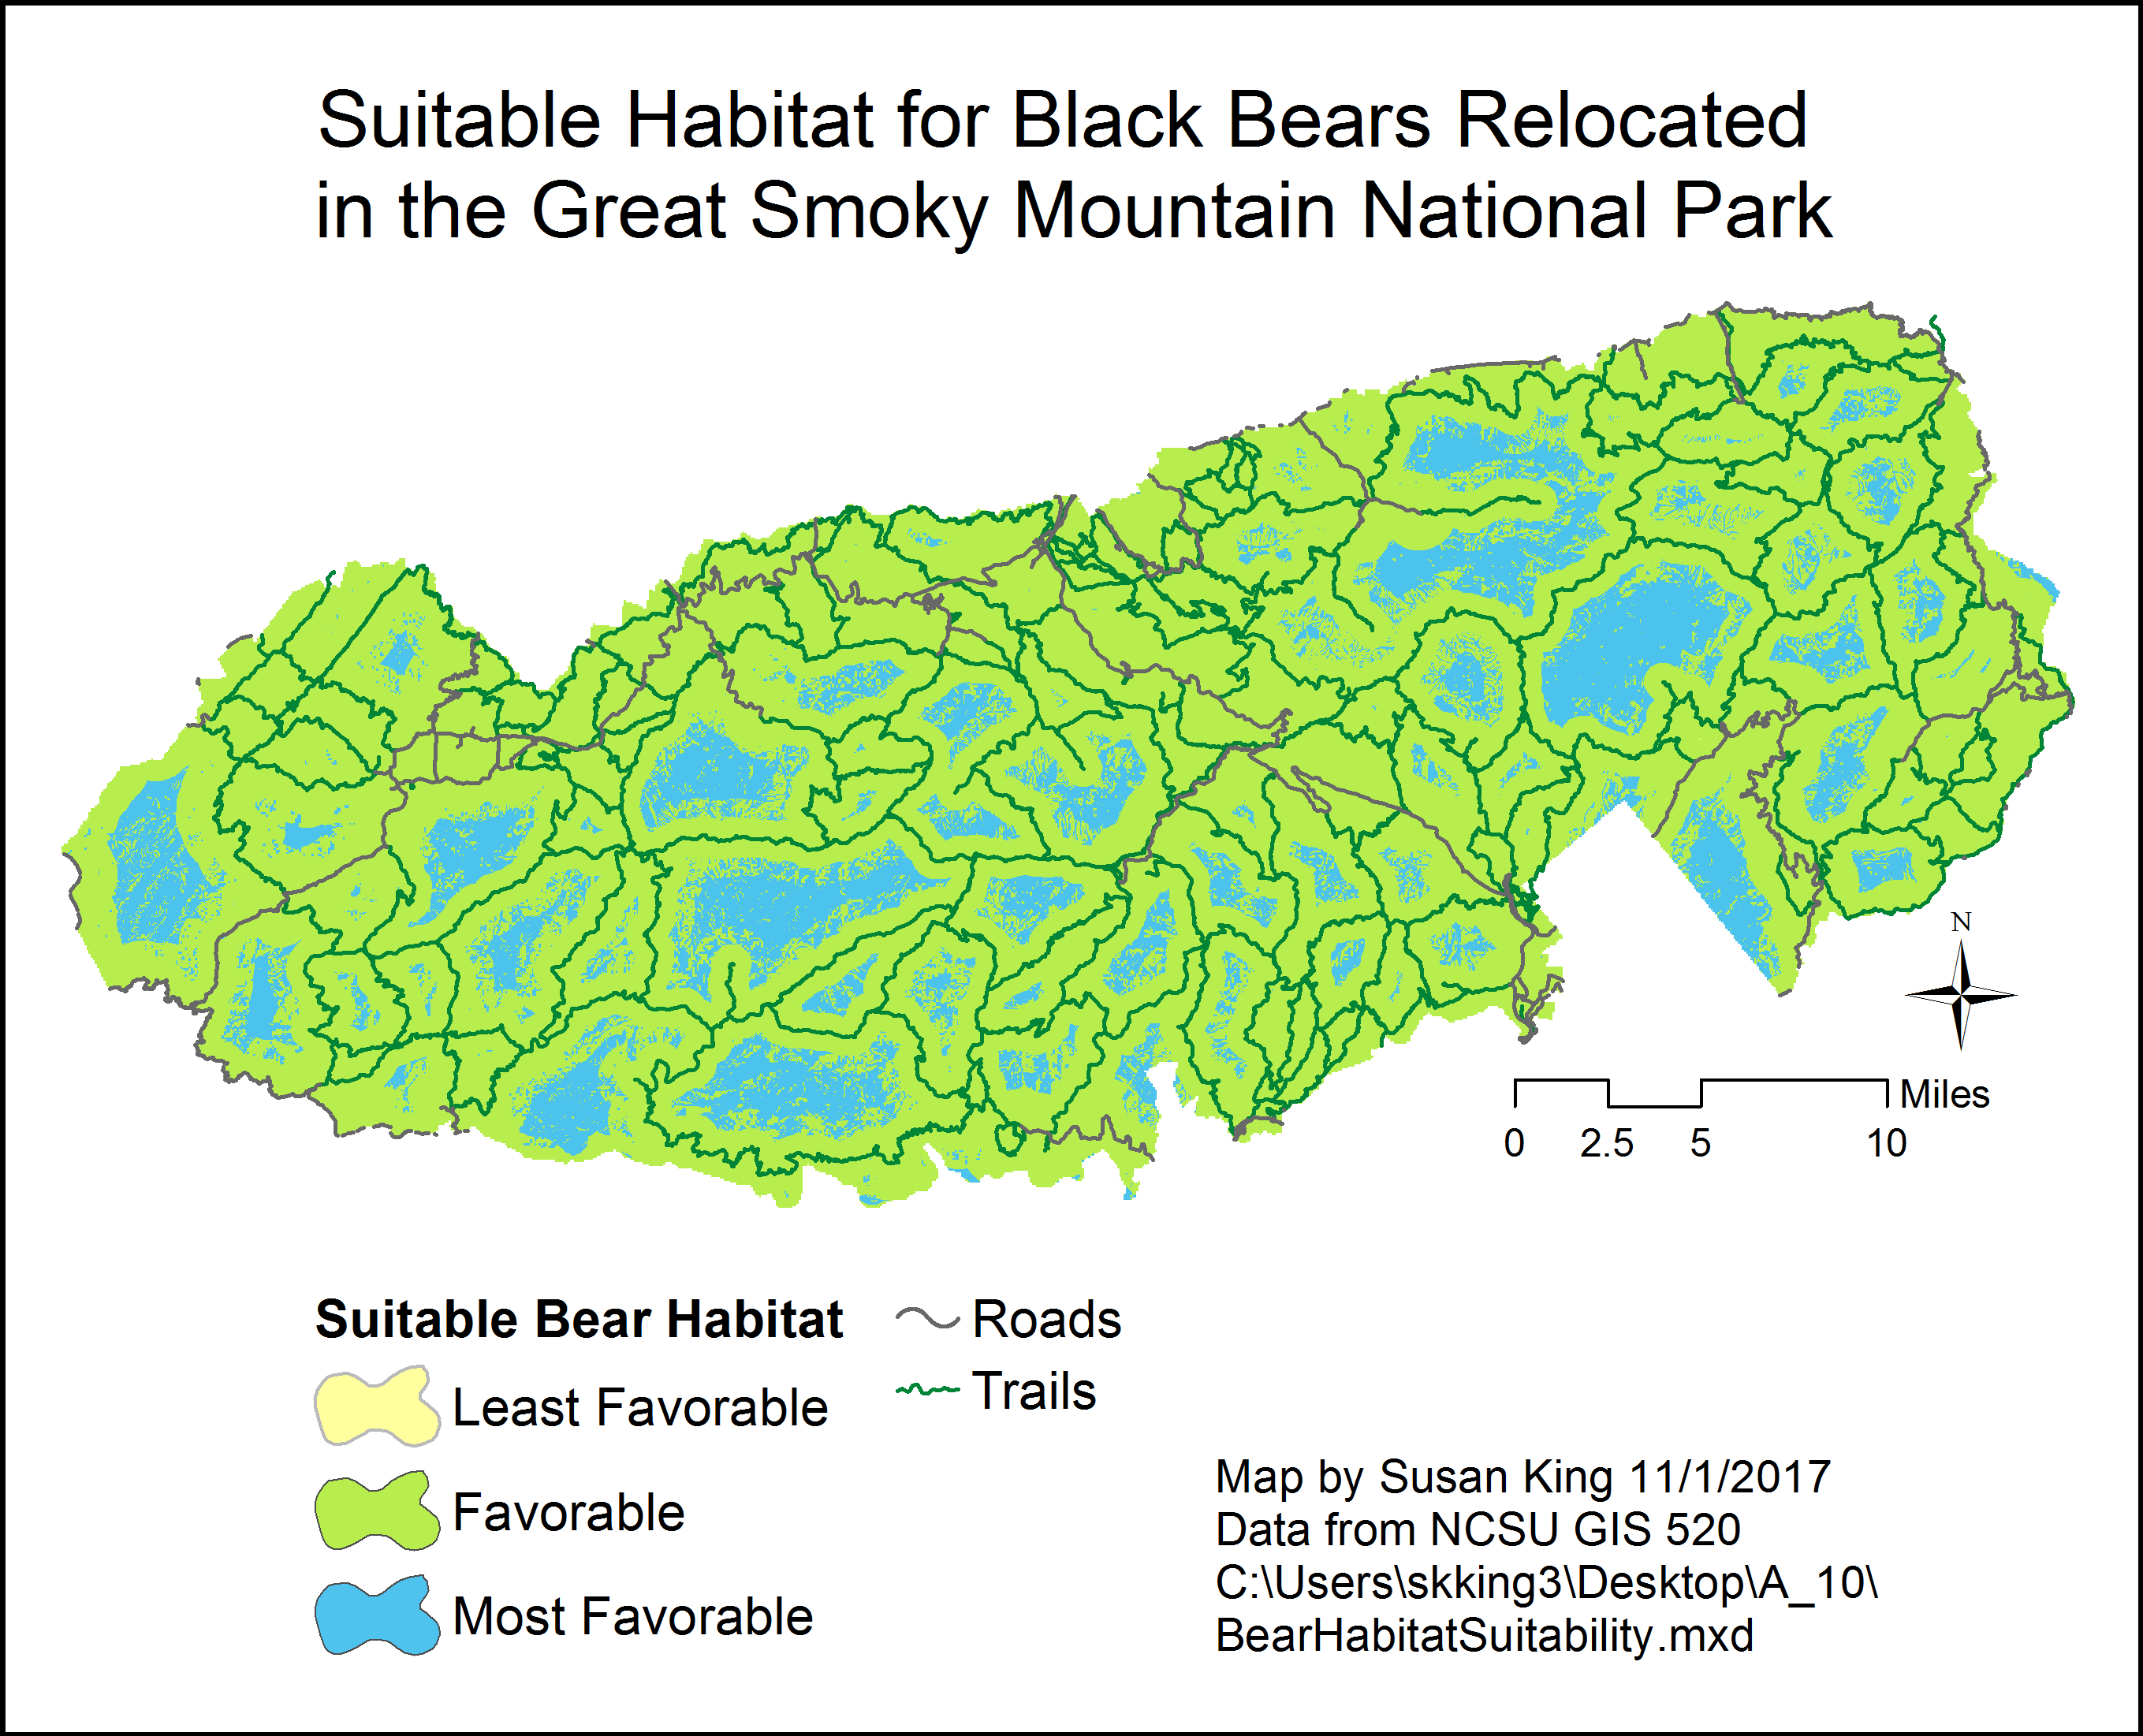 Fig. 2. Results of the weighted overlay analysis. Least favorable habitat was so small that it is not visible at this scale. Roads and Trails are included for reference. Click on image for larger version.
Application and Reflection: The Weighted Overlay function is a very useful tool for evaluating multiple parameters at once, and by using Model Builder to execute the procedure you can adjust settings or re-run the tool with new data very easily.
Problem Description: For my Master’s thesis, I examined the nesting ecology of Four-toed Salamanders in natural and constructed wetlands. I have been asked by the Wildlife Resources Commission to evaluate the suitability of nesting habitat for these salamanders in protected areas near the Appalachian Trail in North Carolina.
Data needed: I obtained land cover, elevation, and trails data from NC OneMap. My previous research indicated which habitat features were associated with areas more likely to be utilized by Four-toed Salamanders for nesting.
Analysis Procedures: Begin by transforming the elevation data using the Slope tool, and using the Euclidean Distance tool to transform the trails and wetland data. The land cover data will be transformed using the Feature to Raster tool. Then run the Reclassify tool on all of the transformed data output files. Finally, use the Weighted Overlay tool to calculate values for a new output layer based on the parameters you set for all of the input layers. Map the final output to visualize the locations that are best suited for four-toed Salamander nesting.
