Exploring Spatial Statistics
Problem: You have several sets of data that need to be explored using spatial statistics to determine if patterns exist based on location, the values associated with that location, or both.
Analysis Procedures:
Strategies and Methods: I will use a variety of spatial statistical tools in Arc Map (version 10.5.1) to search for patterns in our data, beginning by examining the data to determine the appropriate tool to use to answer each question. The data include emergency service calls provided by the Forth Worth Fire Department, library patrons provided by the Oleander Library, and census data available through the U.S. Census Bureau. I used the Average Nearest Neighbor tool to determine if false-alarm calls to EMS services were clustered or not. I used the High/Low Clustering tool to determine if EMS calls that were labeled as high priority were clustered or not. This tool was run over a range of distances to determine the distance at which clustering was strongest (maximum z-score). I then used the Multi-Distance Spatial Cluster tool and input a starting distance and interval and ran the tool through a specified set of permutations to determine the distance at which clustering of calls is highest, or if clustering is occurring due to factors beyond the nearest feature. I calculated the difference between the observed K index and the upper confidence envelope, and then graphed the results to determine the distance at which clustering is most intense (maximum difference). I used the Spatial Autocorrelation tool to determine if both location and associated values are clustered, random, or dispersed – i.e., if the attribute associated with the location influences the clustering. In this case, I joined point data of library patron location with polygons, and a count of library patrons within each polygon was used to run the analysis. I used the Cluster and Outlier Analysis tool to analyze the spatial pattern of the EMS calls and create a map depicting the results in relation to the census data. I ran the Hot Spot Analysis tool to determine if median household income clustered by either high or low values. I created maps to visualize the patterns detected by running the latter two tools (Fig. 1).
Workflow Diagram: Fig 1. Generalized workflow diagram for using spatial statistics.
Results: These tools offer a variety of methods for analyzing data to determine if spatial patterns exist, as well as the possibility of visualizing the output in map format. For example, the Average Nearest Neighbor tool indicated there is clustering in the pattern of the Forth-Worth EMS calls (Z=-1.698, 90%CI, Fig. 2). The High/Low Clustering (Getis-Ord General G) tool indicated that the priority ranking of calls for service was most intensely clustered at 900ft (Z=9.401, 99% CI, Fig. 3). The Multi-Distance Spatial Cluster (Ripley’s K function) tool corroborated this finding, also indicating that priority rankings for calls for service were clustered most intensely at 900 feet (Table 1, Fig. 4). The Spatial Autocorrelation (Moran’s I index) tool showed the clustering of the location of Oleander Library patrons (Z=12.059, Fig. 5). The Cluster and Outlier Analysis output can show the location of the cluster analysis, with hot spots, cold spots, and outliers all highlighted (Fig. 6). The Hot Spot Analysis shows the clusters of high and low income in Dallas County (Fig. 7).
 Fig. 2. Locations of calls to the Fort Worth Emergency Management Services in February 2015. Click on image for larger version.
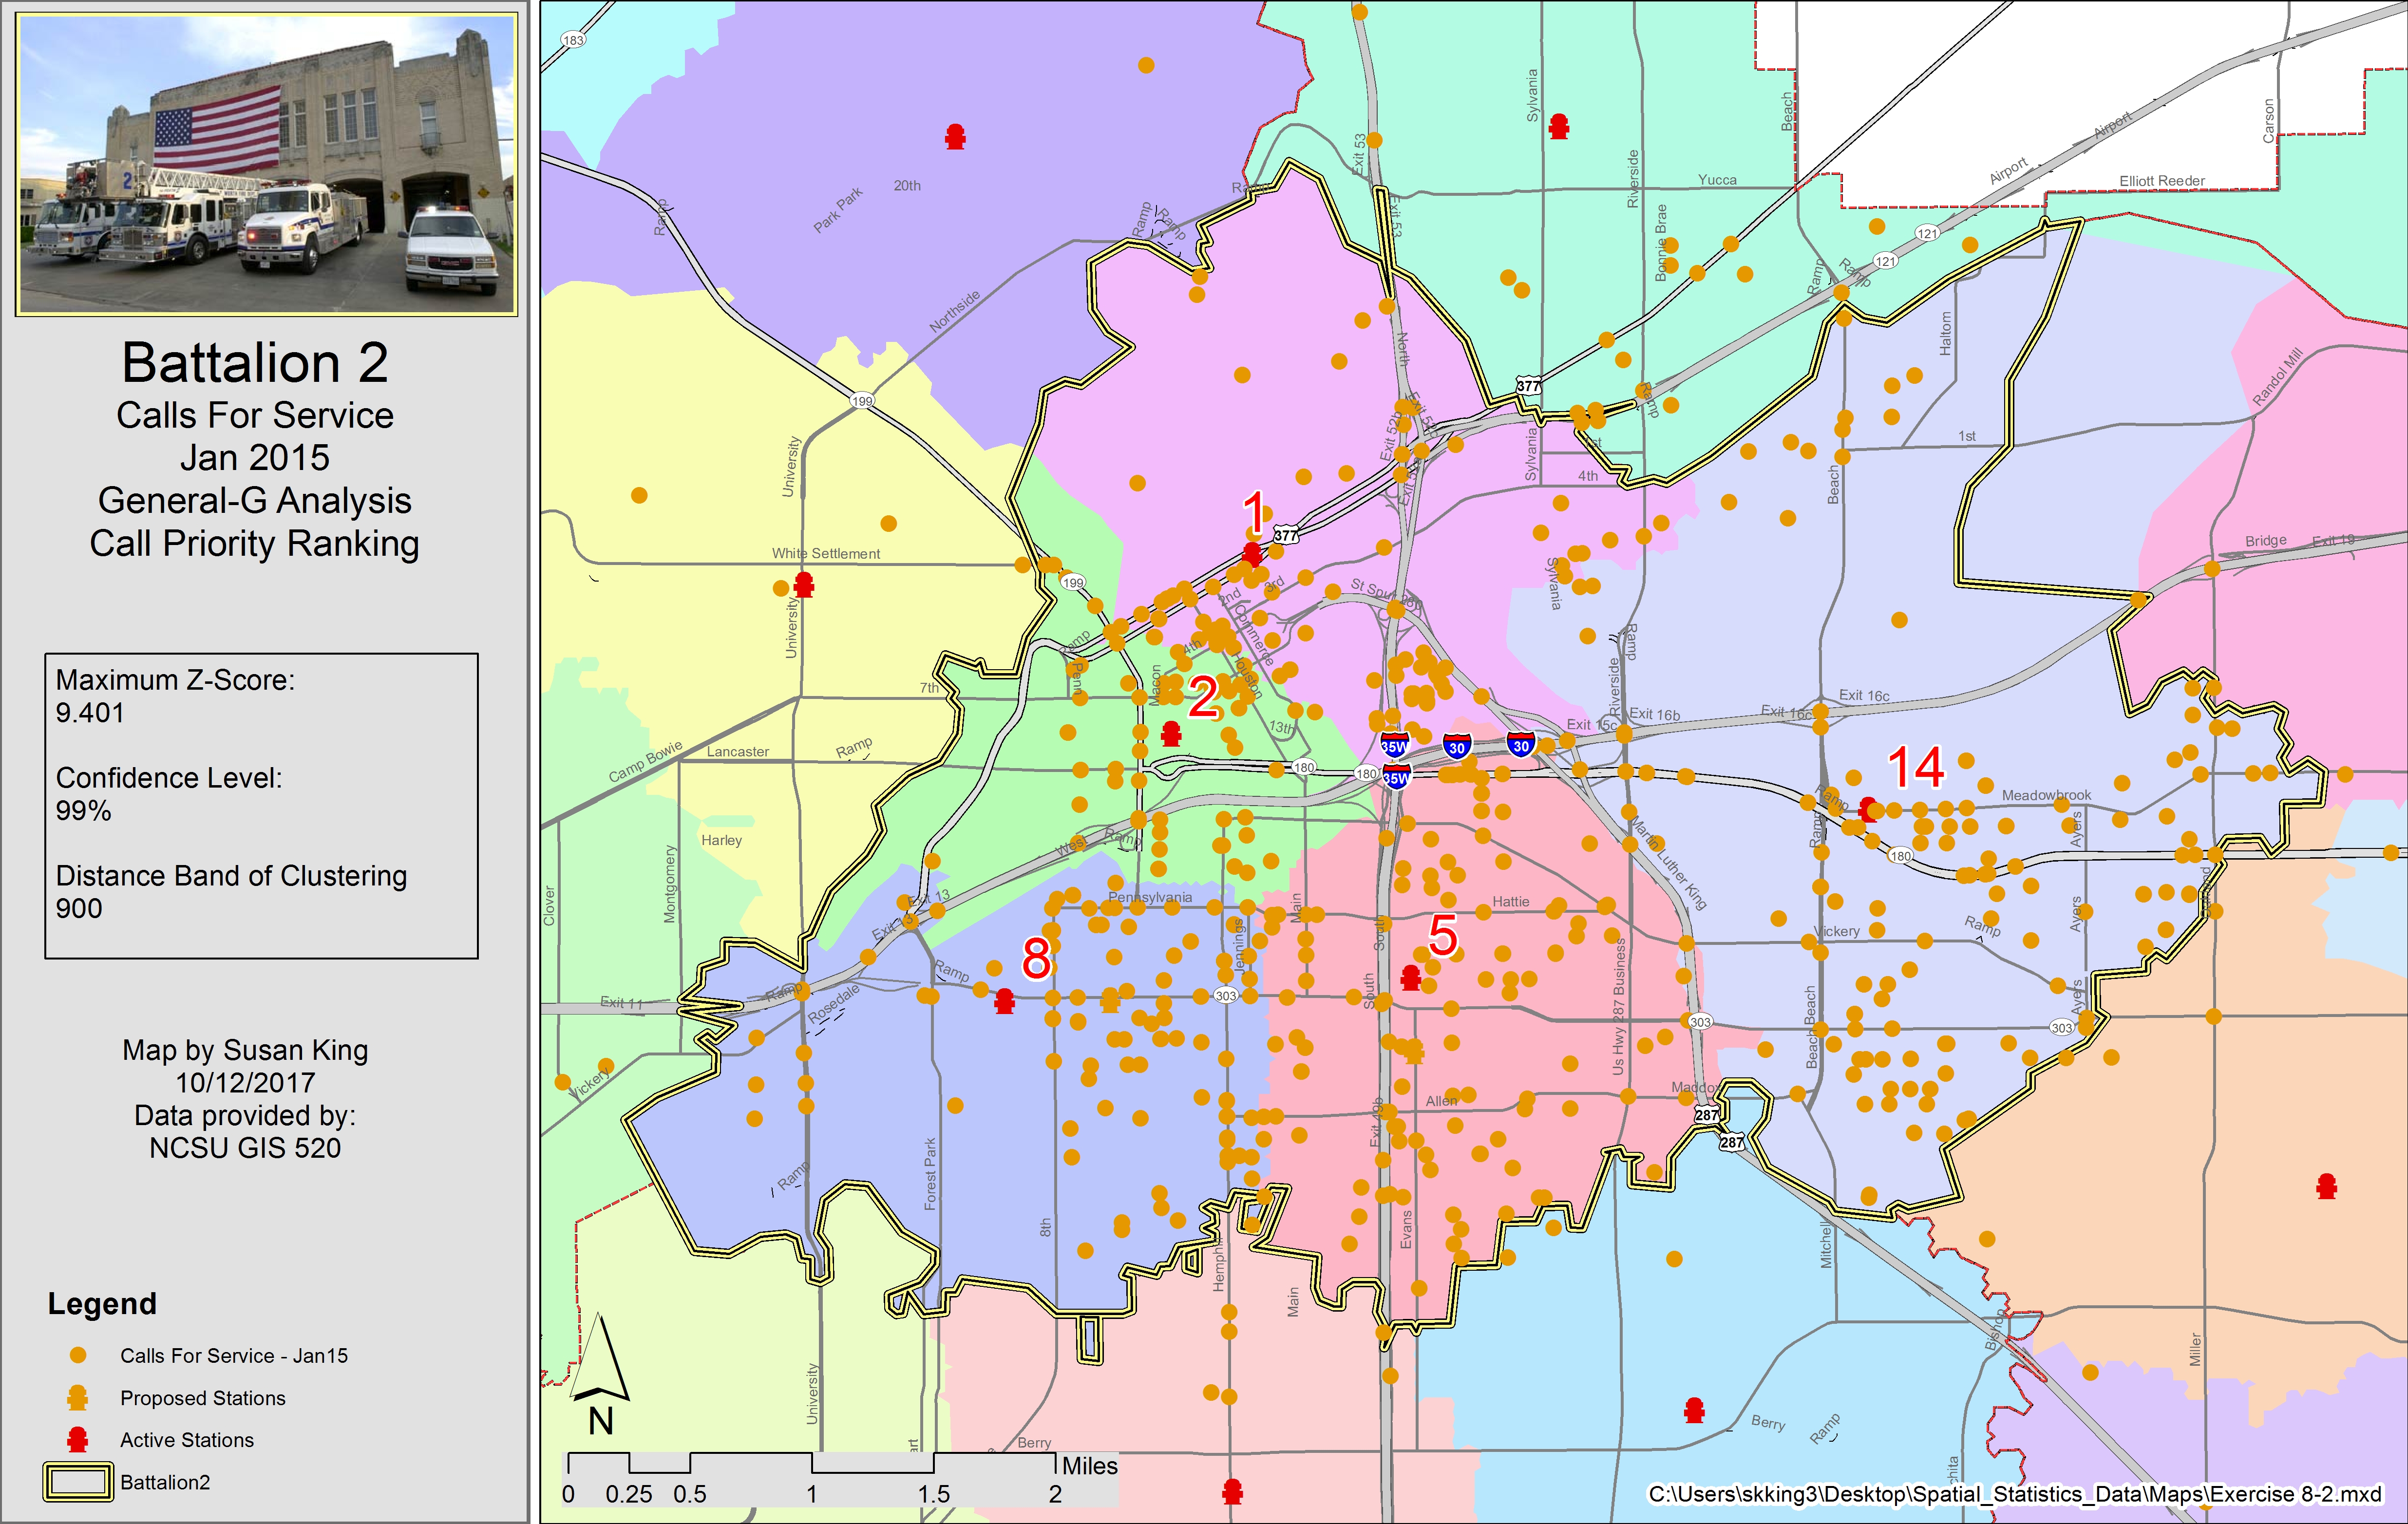 Fig. 3. Locations of calls to the Fort Worth Emergency Management Services in January 2015, with results reported for the High/Low clustering tool. Click on image for larger version.
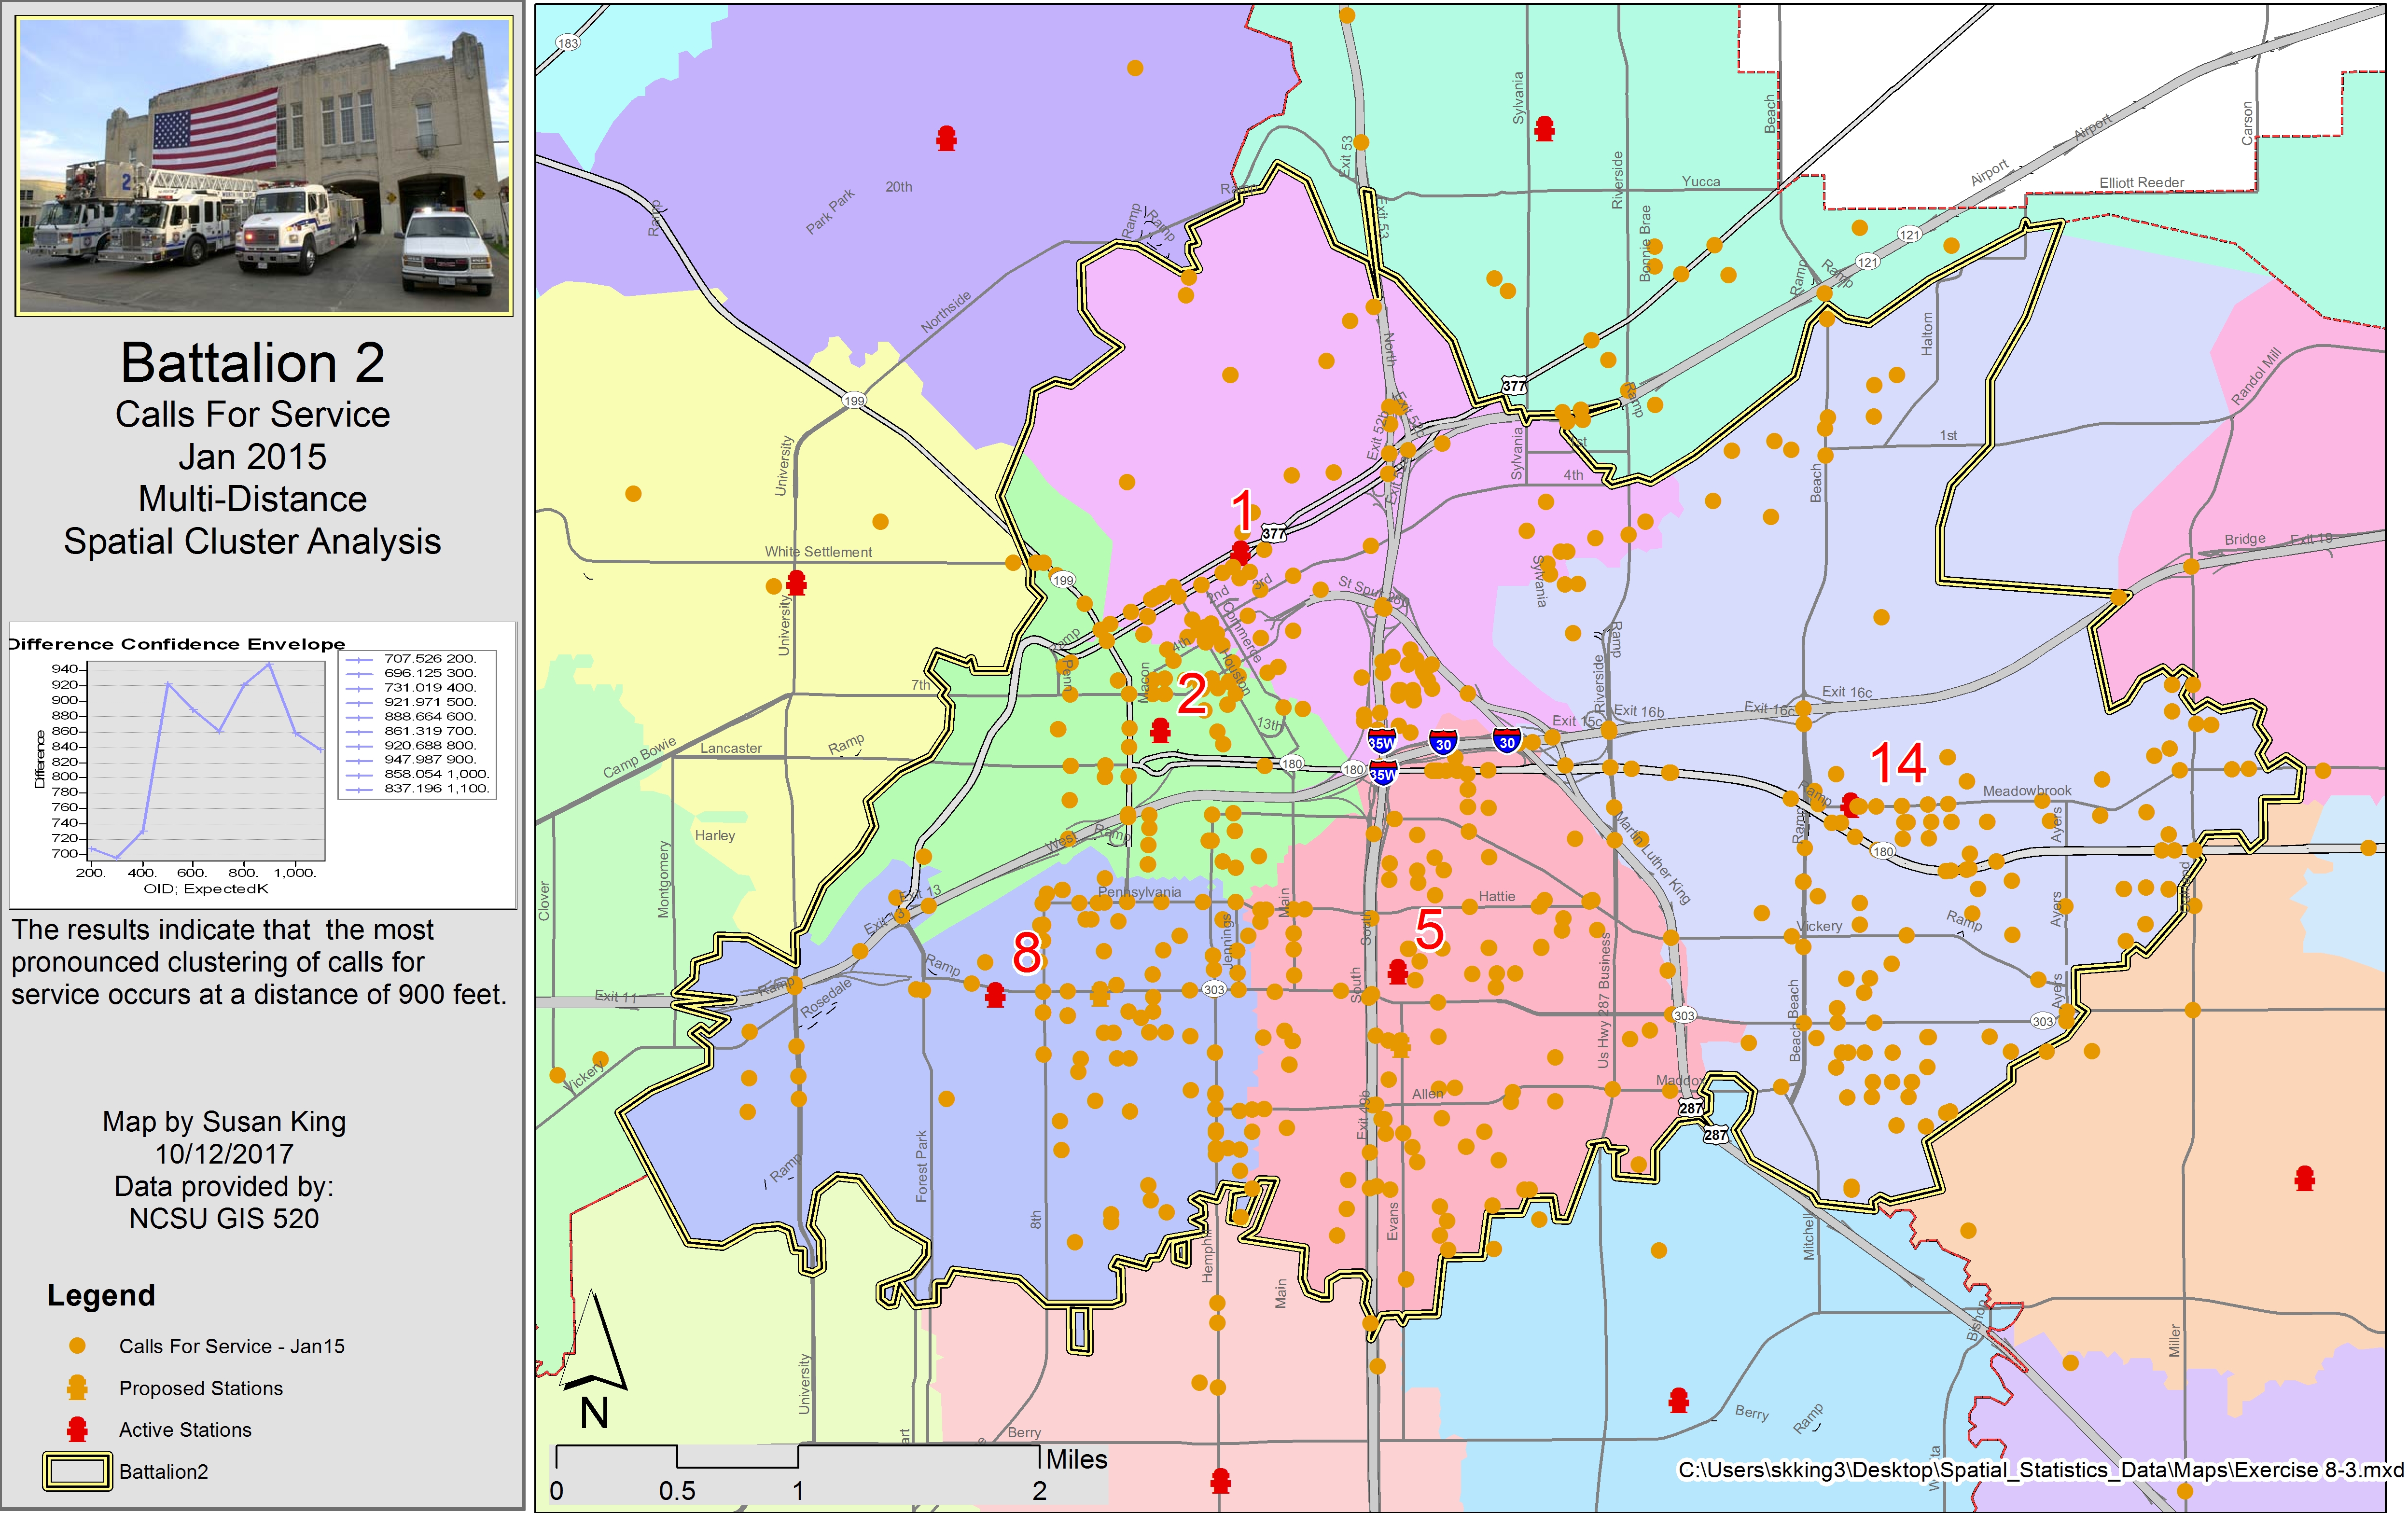 Fig. 4. Locations of calls to the Fort Worth Emergency Management Services in January 2015, with results reported for the Multi-Distance Spatial Cluster tool. Click on image for larger version.
Table 1. The difference in the observed K value and the upper confidence envelope indicates that clustering of calls is most intense at 900 feet.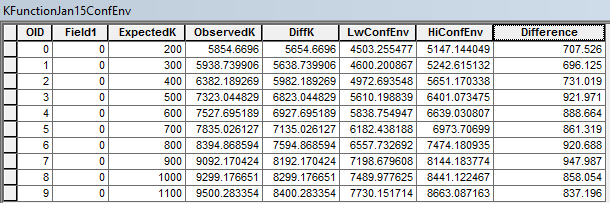
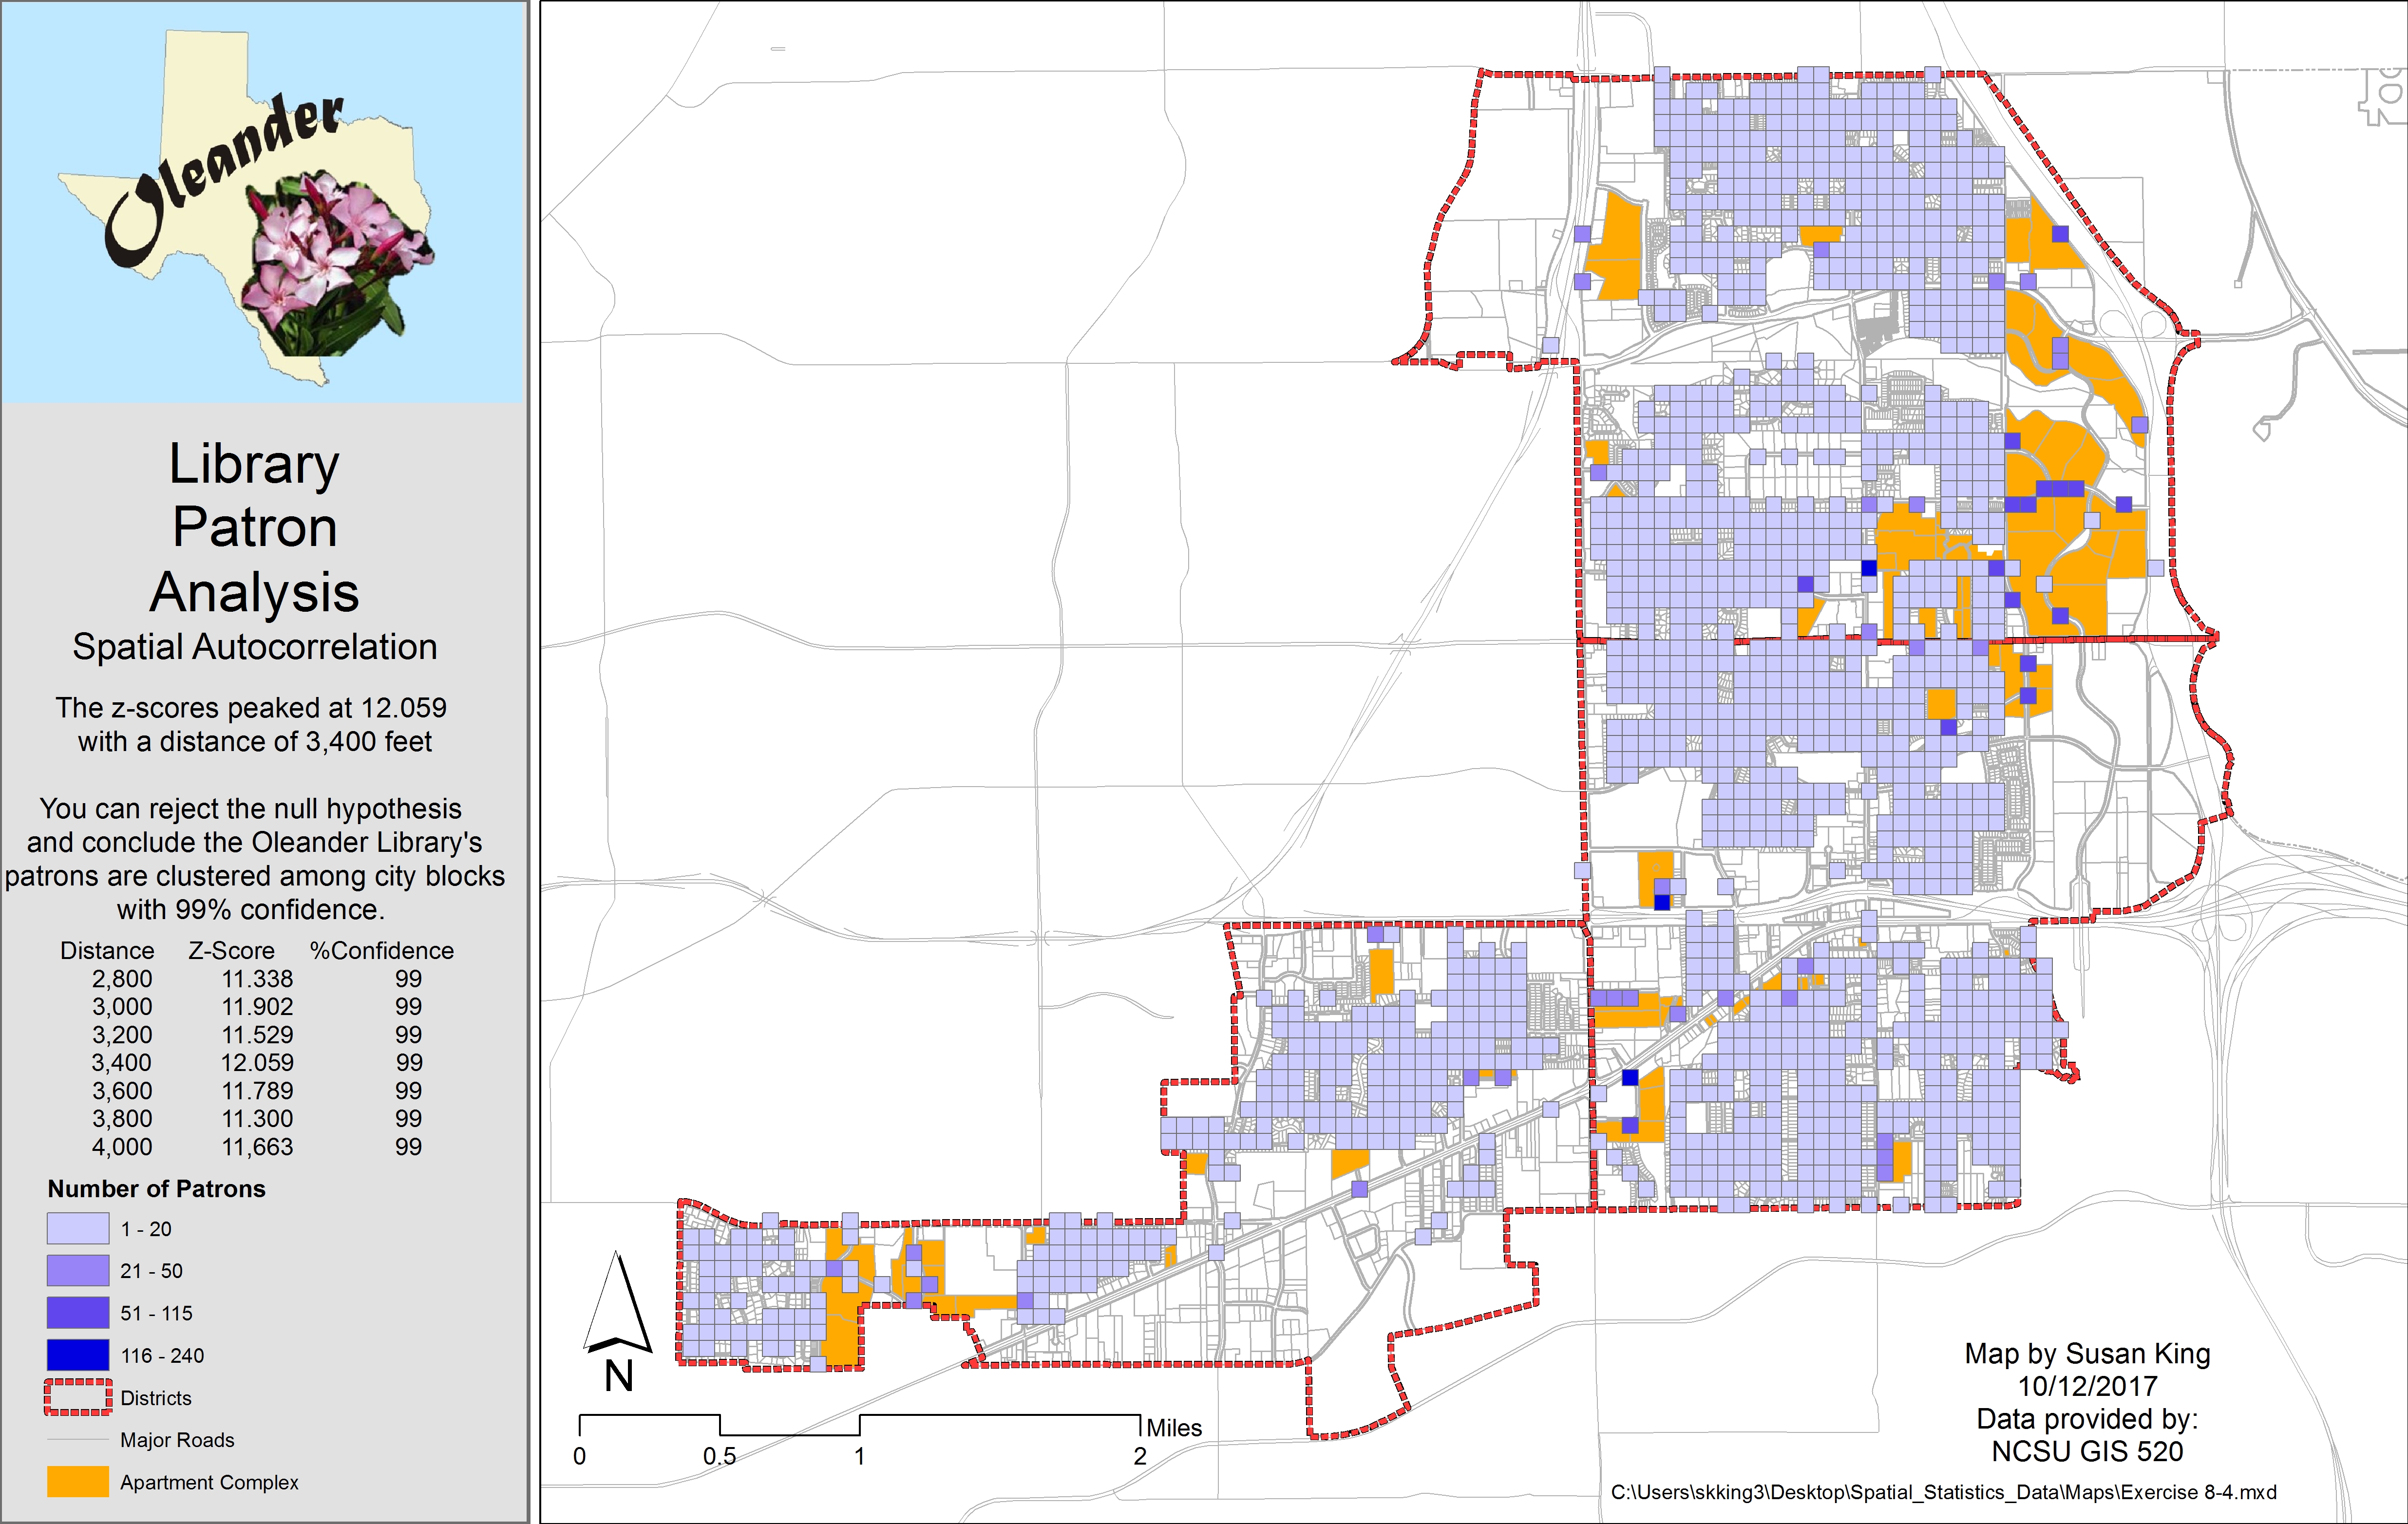 Fig. 5. The Oleander library patrons’ locations and the results of the Spatial-Autocorrelation tool. Click on image for larger version.
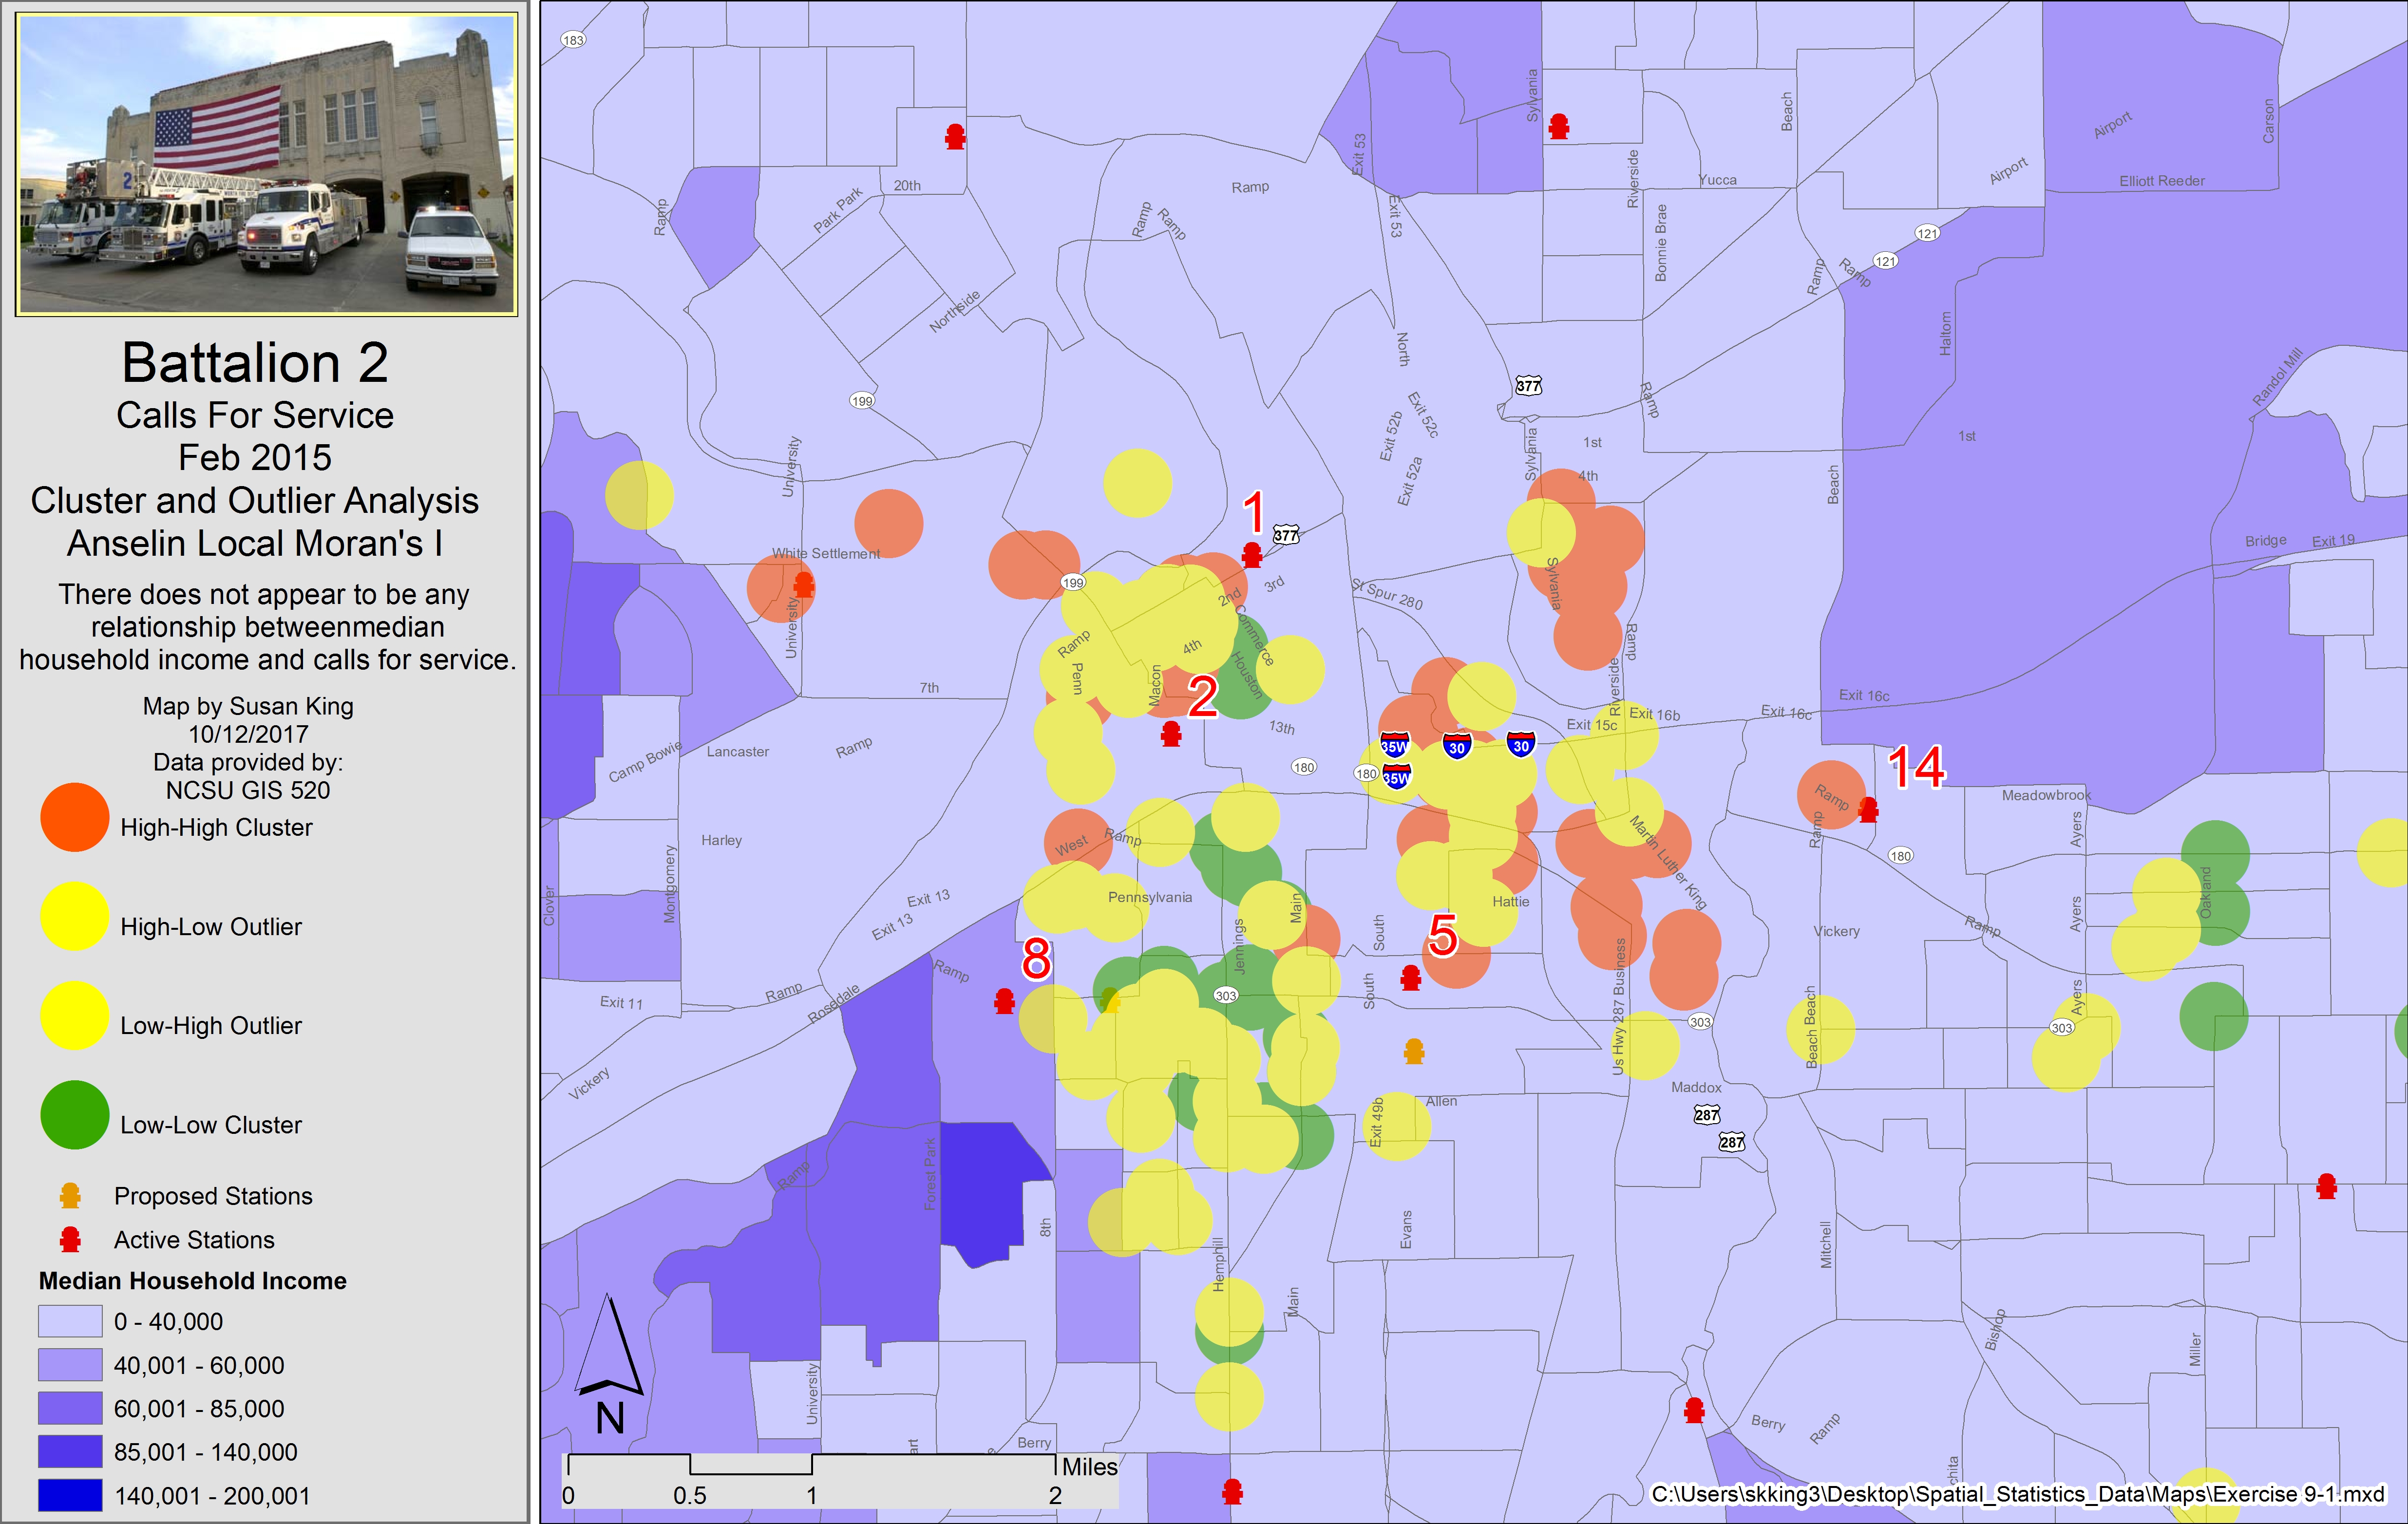
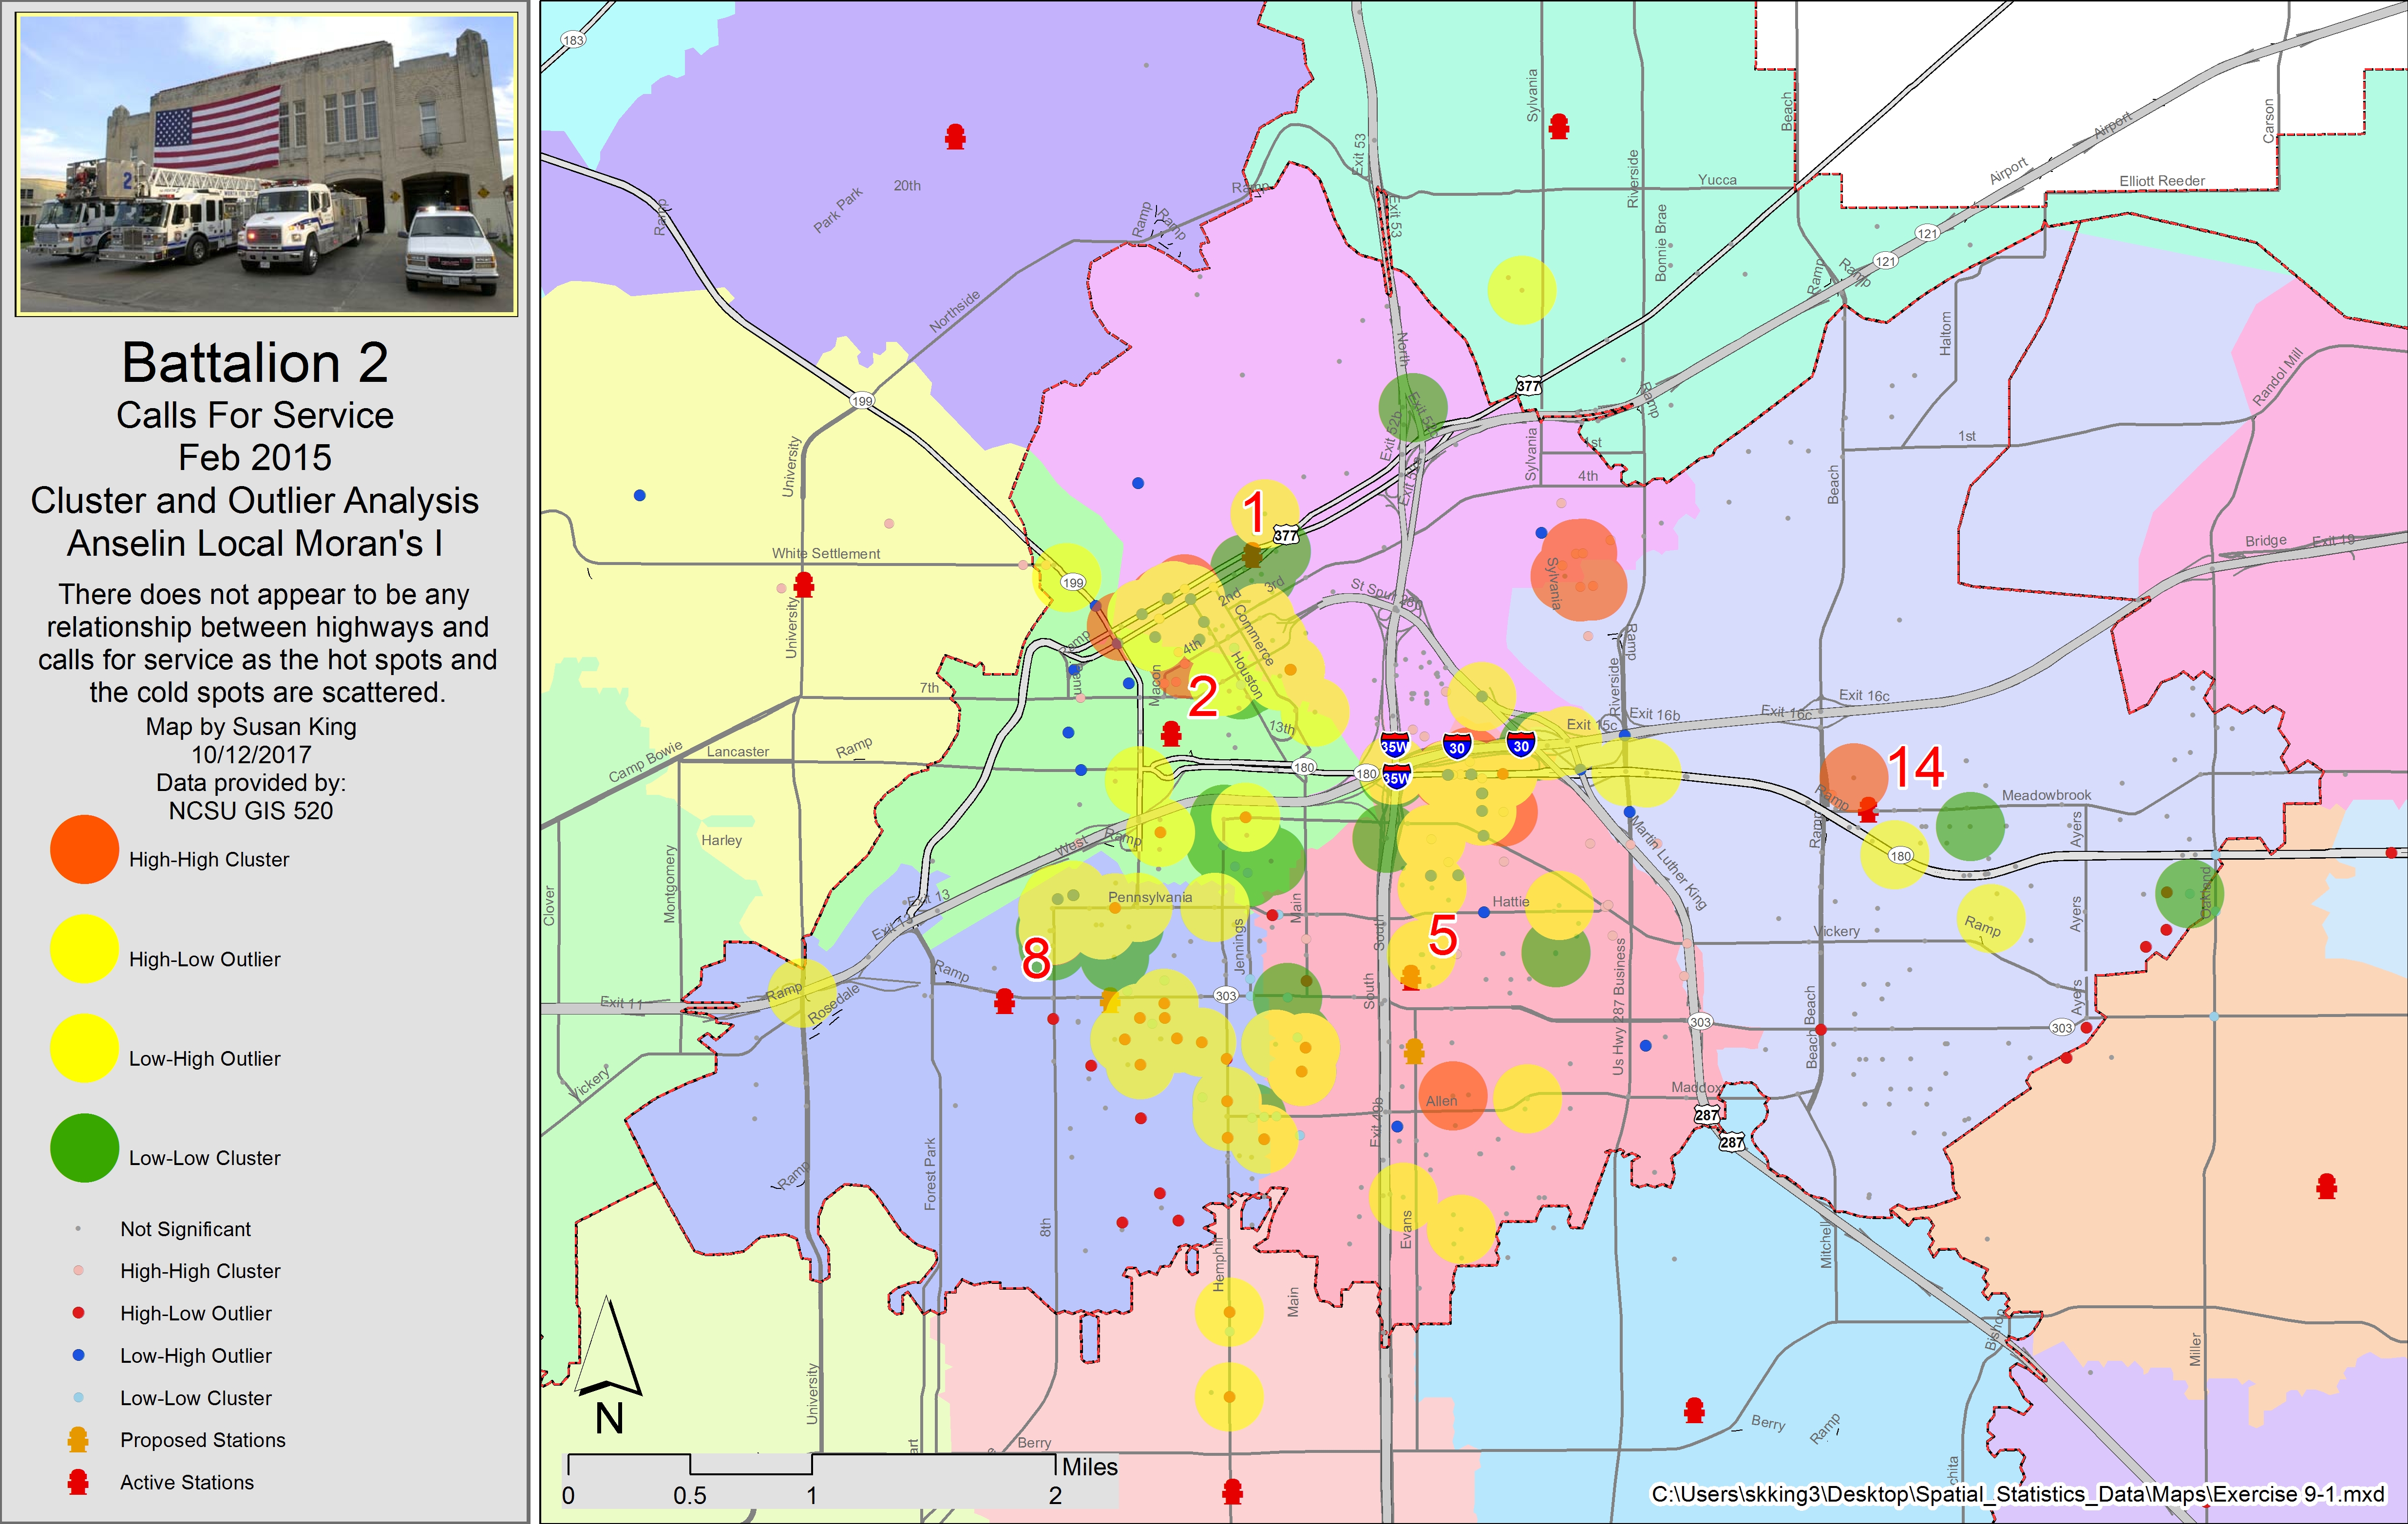
Fig. 6. Hot spots and cold spots of calls for service to the Fort Worth Emergency Management Services in January 2015 do not appear to be spatially related to median household income (left/top) or to the major highways (right/bottom). Click on image for larger version.
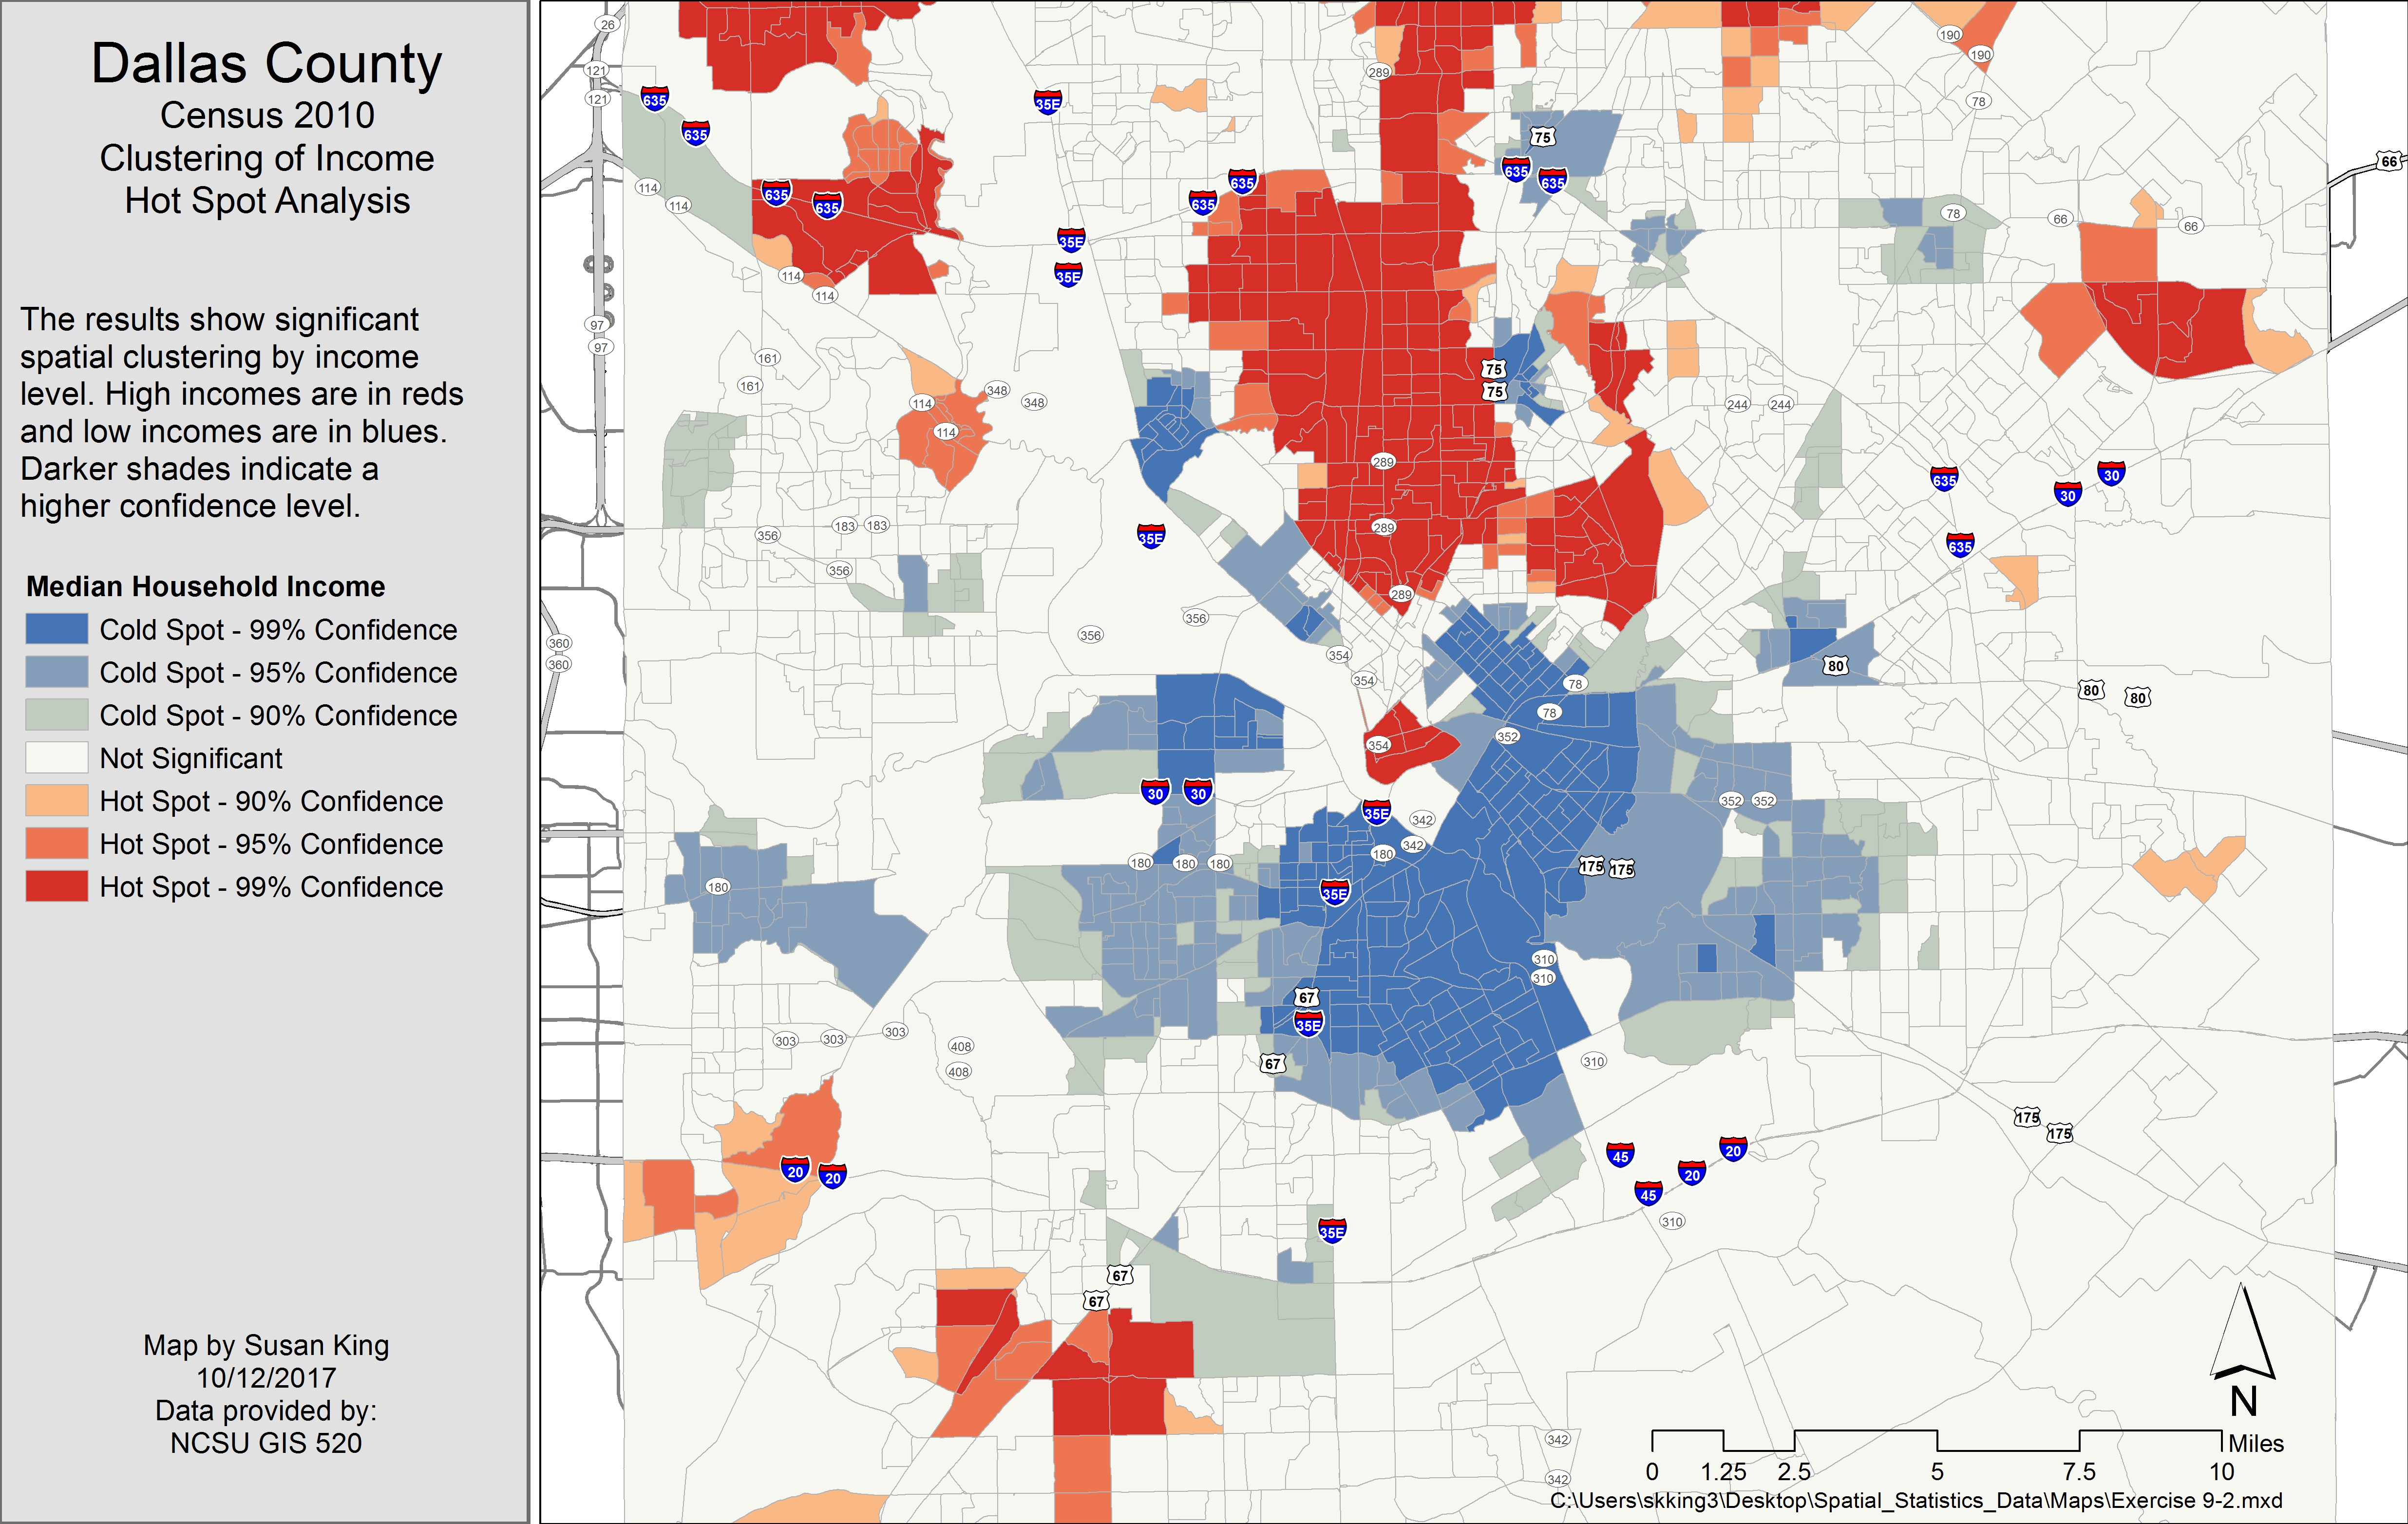 Fig. 7. The median household income in Dallas County is clustered in to hot spots (higher income) and cold spots (lower income). Click on image for larger version.
Application and Reflection: Scientific research is driven by statistical analyses of data, and the spatial analyst tools in ArcMap offer a variety of tools and methods accomplish this. These methods can be applied to a variety of other analyses and can serve as a ‘starting point’ when trying to determine if patterns exist, or what factors might be contributing to any noted patterns.
Problem Description: Cytauxzoonosis is a deadly vector-borne disease that affects domestic cats. The College of Veterinary Medicine (CVM) at North Carolina State University has one of the leading research programs studying this disease. They have asked you to analyze the locations of cases for cytauxzoonosis in Chatham and Orange Counties, North Carolina.
Data needed: You need the locations of all cases in these areas. The CVM had the locations of all cases reported to them, and you are able to poll a list of veterinarians practicing in these counties to obtain additional locations of cases that have been treated but not reported to the CVM.
Analysis Procedures: Run the Average Nearest Neighbor tool to determine if there is clustering in the locations of feline cytauxzoonosis cases. If you find clustering occurs, you can then run a Spatial Autocorrelation tool to determine if density (count per area) data are clustered. You could use the Cluster and Outlier Analysis tool to show hot spots, cold spots, or outliers in the location of cases. A Hot Spot Analysis would then be run to show locations of hot spots or cold spots of the density of cases. These tools may be useful in further epidemiological study of the outbreaks of feline cytauxzoonosis.
